This issue has been resolved with a software or firmware update.
This issue was fixed in Graphical Analysis v5.18.1. To resolve the issue, update the latest version of Graphical Analysis.
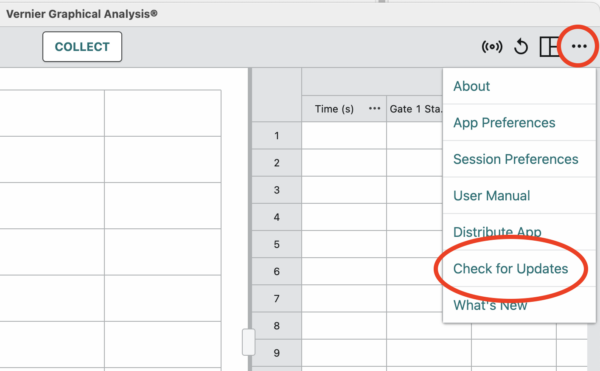
To check if there is an update available, click or tap Other Options, ![]() , and select Check for Updates.
, and select Check for Updates.
Windows users, see Graphical Analysis fails to update on Windows.
If Your Device Cannot be Updated
There is a bug in Graphical Analysis and Graphical Analysis Pro v5.18.0-3098 when measuring linear motion (distance, velocity, and acceleration) in which the flag spacing reverts to 0.05 m and the number of flags reverts to 8 when different objects are chosen such as the Ultra Pulley or the Cart Picket Fence. This affects all experiments using the photogate including experiments using the original Centripetal Force Apparatus (CFA), but NOT including Picket Fence Free Fall using the Vernier Picket Fence (PF).
There are two workarounds for this problem.
Workaround 1—Before data collection
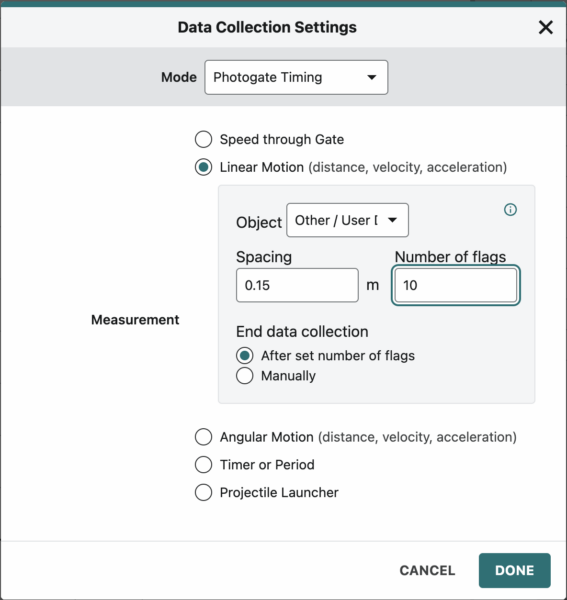
Before data collection, in the photogate settings, change the object to Other / User Defined and enter the following values for Spacing and Number of Flags for the object you are using.
| Object | Spacing | Number of Flags |
|---|---|---|
| Cart Picket Fence | 0.01 | 13 |
| Ultra Pulley – in groove | 0.015 | 10 |
| Ultra Pulley – outside edge | 0.016 | 10 |
| Bar Tape | 0.016 | any value* |
IMPORTANT: The first data set collected will look incorrect, as if the bug has affected this too. To correct the problem, open the Data Collection Settings again, note that your settings are still there (the number of flags has changed to 8, but that does not affect your measurements), and click or tap Done. Your subsequent data collection trials will be correct. If you like, delete Data Set 1. To do this, go to the data table and click or tap the three dots at the right end of the bar marked Data Set 1. Select Delete Data Set. When a window pops up to confirm that you want to delete the data set, click or tap Delete.
Workaround 2—After data collection
After data collection, in the data table, create new distance calculated column to correct the distance values, then create a new velocity calculated column data from your new distance column.
| Click or tap the three dots in the heading of the distance column. Select Add Calculated Column. | 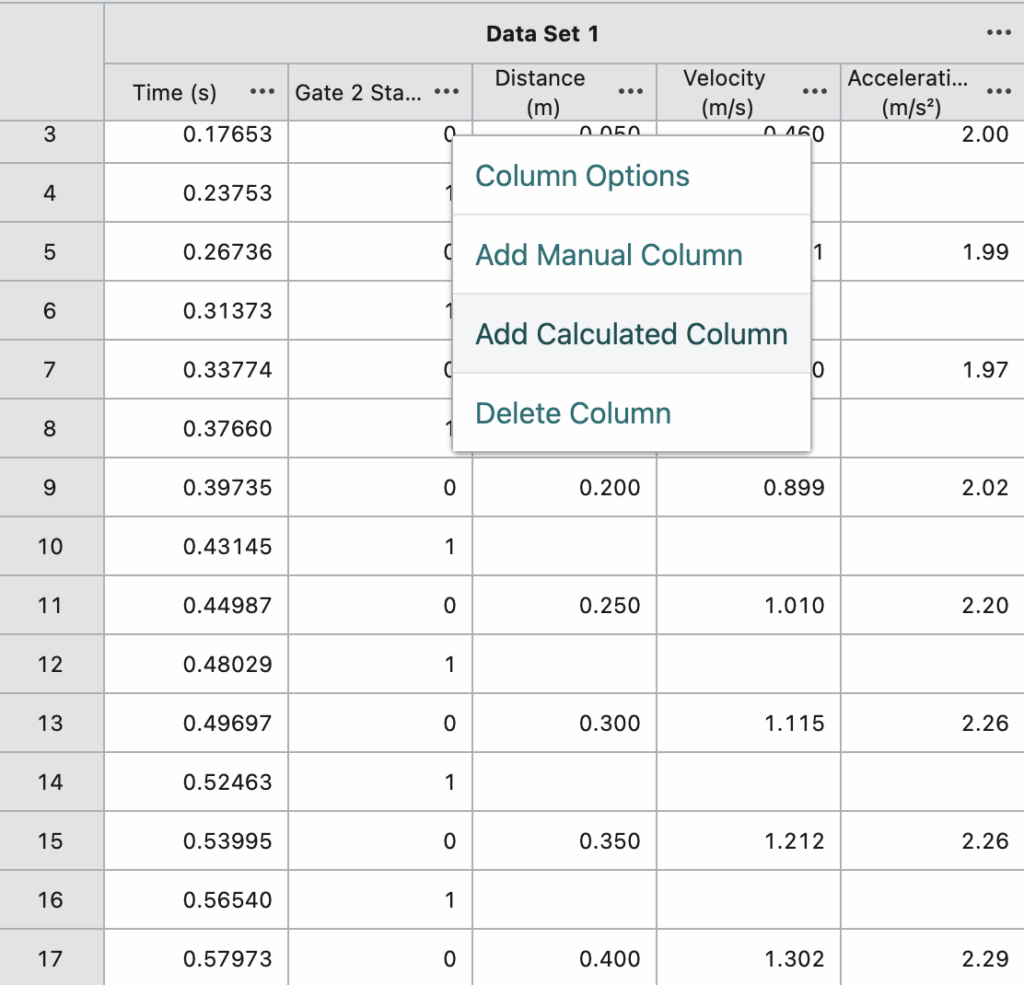 |
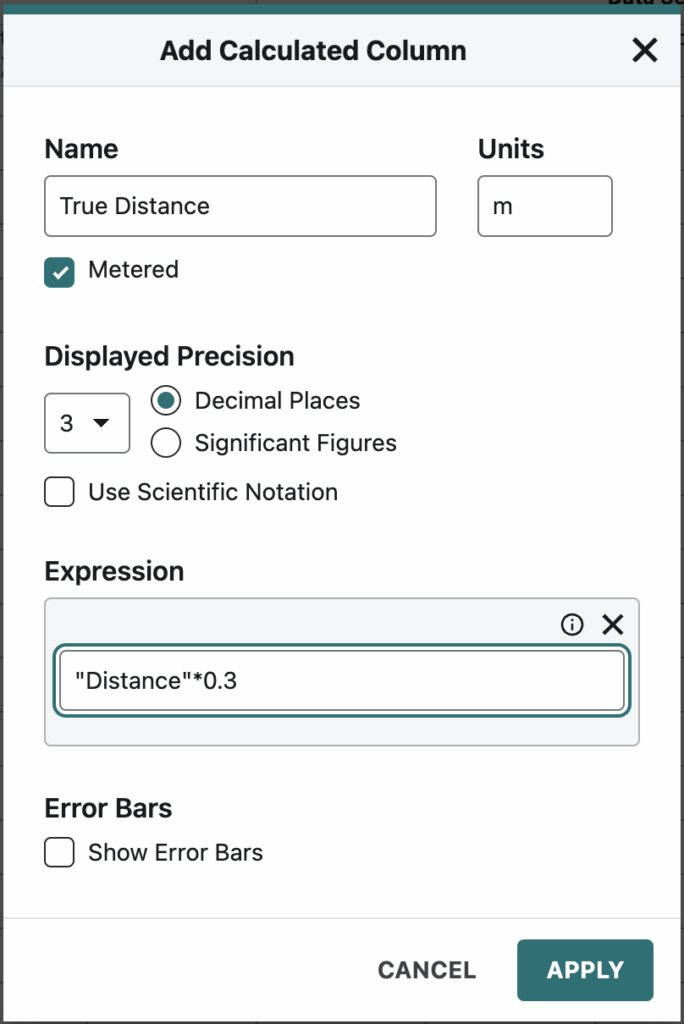
| To create a column for the correct distance values, follow these steps:
1. Enter a name and units for the calculated column. If you are not using Graphical Analysis Pro, choose the expression A*X^B and enter 0.3 for Parameter A (or the appropriate factor for your object), Distance for Column X, and 1 for Parameter B. Click or tap Apply. |
 |
| To create a column for the correct velocity values, follow the steps similarly to creating the correct distance column, but use the expression 1st Derivative (Y,X). | 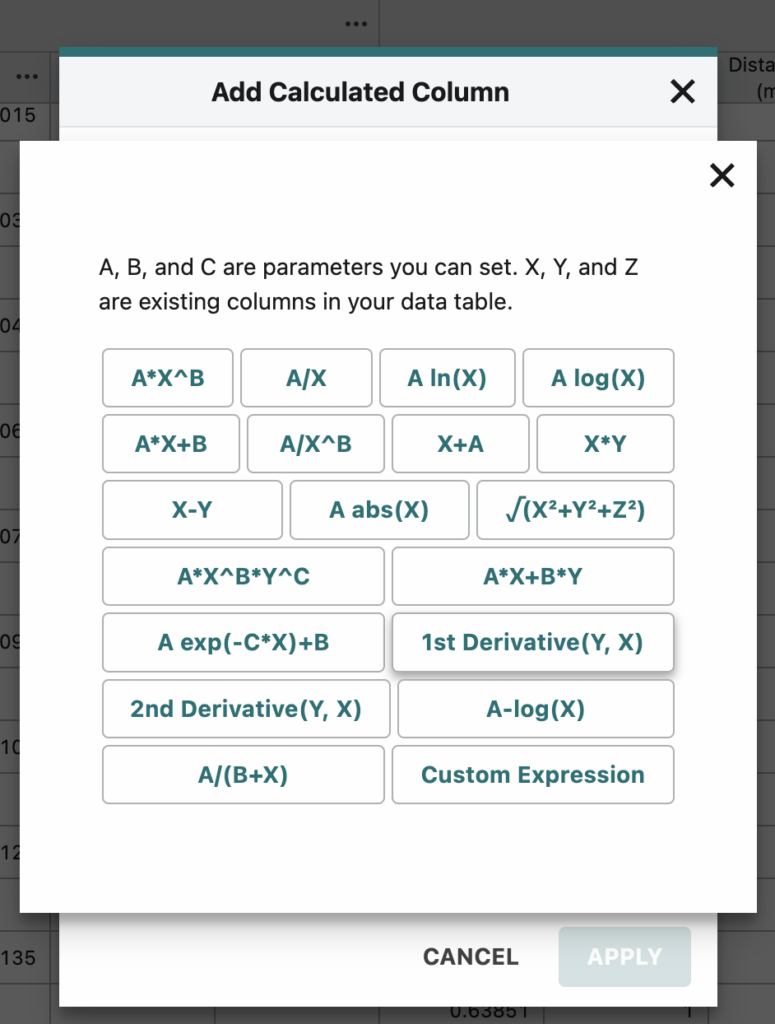 |
| Select your corrected distance column in the dropdown menu for Column Y, and select Time for Column X. Now you will have a corrected Velocity column. | 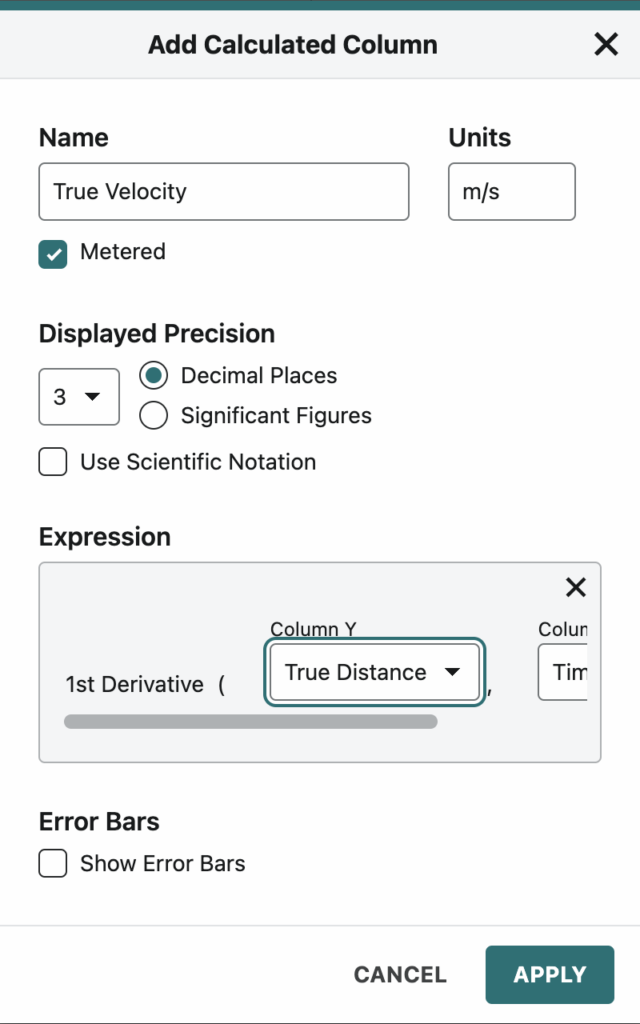 |
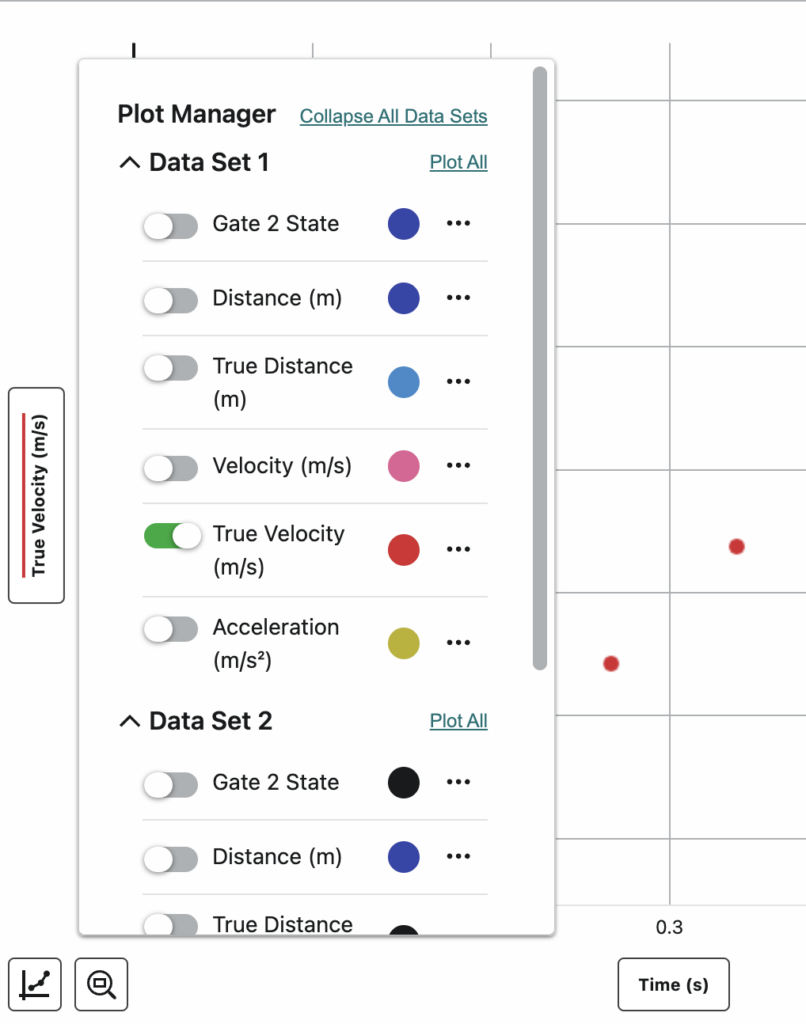
| Now you can graph the corrected velocity vs. time and determine the acceleration, if desired.
Click or tap on the vertical axis label of your graph to open the Plot Manager. Then select the column you would like to graph. |
 |