When you first connect a photogate, the associated sensor meter shown in the software should read “Unblocked” or 0. You can test the photogate by fanning your fingers and passing them through the gate. The indicator LED on the photogate will light each time your finger blocks a gate.
Why does my Vernier Photogate (VPG-BTD) not respond to block/unblock events?
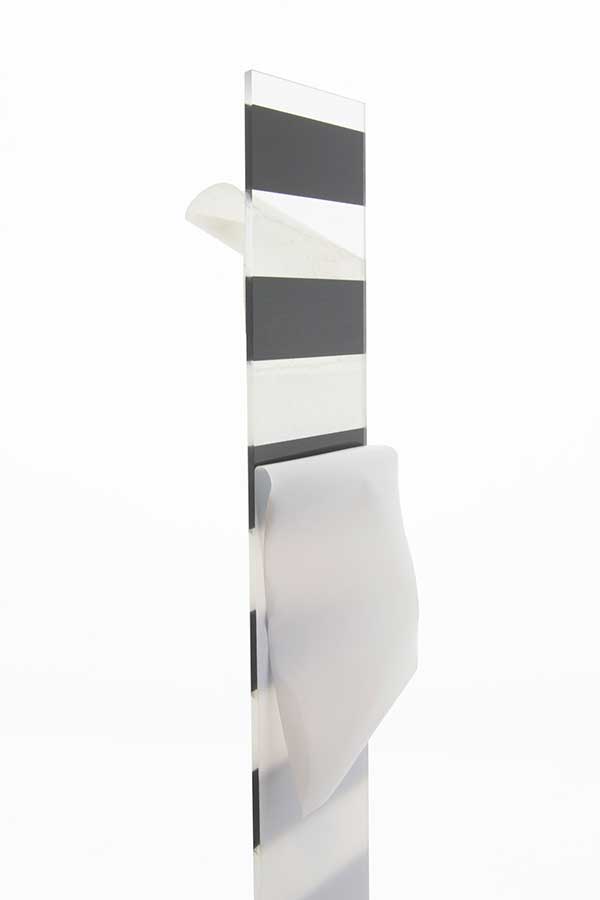
If you are using a new Picket Fence, check to make sure you have peeled the protective coating off of both sides of the acrylic as shown in the photo below. In order to work properly, the picket fence must have transparent spaces alternating with opaque black stripes.
Also – Make sure you are using the larger picket fence, Picket Fence (PF), which is meant for dropping through a photogate. The results will not work correctly if you use the smaller Cart Picket Fence (PF-CART) that is included with some of the cart and track kits.
Using a Vernier Photogate (VPG-BTD) to measure g
1) Attach the included rod to the Vernier Photogate and mount it to a ring stand using a right angle clamp. The photogate arms should be horizontal. This will allow the vertically falling Picket Fence to pass through the photogate.
2) Hold the Picket Fence lengthwise above the photogate between two fingers, allowing the Picket Fence to hang freely at the center of the photogate. Position the Picket Fence as closely as possible to the Photogate opening without blocking the opening.
3) Start data collection. (The default photogate data collection mode for the Vernier Photogate is Motion Timing.)
4) Drop the Picket Fence by releasing it from your fingers as cleanly as possible. Data collection will stop automatically after the eight bars of the picket fence pass through the photogate.
When you drop a Picket Fence through a Photogate you should see a parabolic-shaped, increasing Distance vs. Time graph and a linear, increasing Velocity vs. Time graph. A linear fit of the velocity data will give you an empirical value for the acceleration, in this case, g.
Using a Go Direct Photogate (GDX-VPG) to measure g
1) Attach the included rod to the Go Direct Photogate and mount it to a ring stand using a right angle clamp. The photogate arms should be horizontal. This will allow the vertically falling Picket Fence to pass through the photogate.
2) Align the photogate so that Gate 1 is above Gate 2.
3) Hold the Picket Fence lengthwise above the photogate between two fingers, allowing the Picket Fence to hang freely at the center of the photogate. Position the Picket Fence as closely as possible to the photogate opening without blocking the opening.
4) Start data collection. (The default photogate data collection mode for the Go Direct Photogate is Time Based.)
5) Drop the Picket Fence by releasing it from your fingers as cleanly as possible.
6) Stop data collection.
When you drop a Picket Fence through a Go Direct Photogate you should see a linear, increasing Velocity vs. Time graph. A linear fit of the velocity data will give you an empirical value for the acceleration, in this case, g.
In our repeated hand trials, we have seen a standard deviation around .03 m/s^2. For tips on reducing this error and comparing it to a local value for g, see
How can I compare my g measurements to a local value and improve their accuracy?