Sharing ideas and inspiration for engagement, inclusion, and excellence in STEM

Since COVID-19 cases remain stubbornly high across the country, it’s clear that remote learning isn’t going away. And while this teaching concept isn’t new anymore, many STEM educators are still struggling to beat video conference fatigue and keep students engaged in the remote classroom. For science teachers who depend on hands-on experiments to demonstrate scientific concepts, remote learning presents a unique question: how do you remotely teach science in a way that holds students’ attention?
Vernier Graphical Analysis™ Pro, the new, enhanced version of the Vernier Graphical Analysis™ app, includes exclusive features designed to support educators and students learning from home. The Pro version enriches the remote classroom by making learning active again—try it out with a free 30-day trial to inspire your students even as they learn from home.
1. Share Experiment Data in Real Time
Perhaps the greatest challenge educators face with remote learning is overcoming video conference fatigue. With Vernier Graphical Analysis Pro, educators can use Vernier sensors to share live experiment data with the entire class. Doing so gives students the opportunity not just to see the experiment over video but to analyze the data in real time.
Best Practices
- Consider combining data sharing with a video view of the experiment setup, or even with screen sharing of your Graphical Analysis session, to both demonstrate analysis options and to provide data to students.
- Incorporate the use of the Prediction tool within the app in combination with polls or breakout rooms to engage students with content before showing data collection.

2. Use Our Sample Experiments
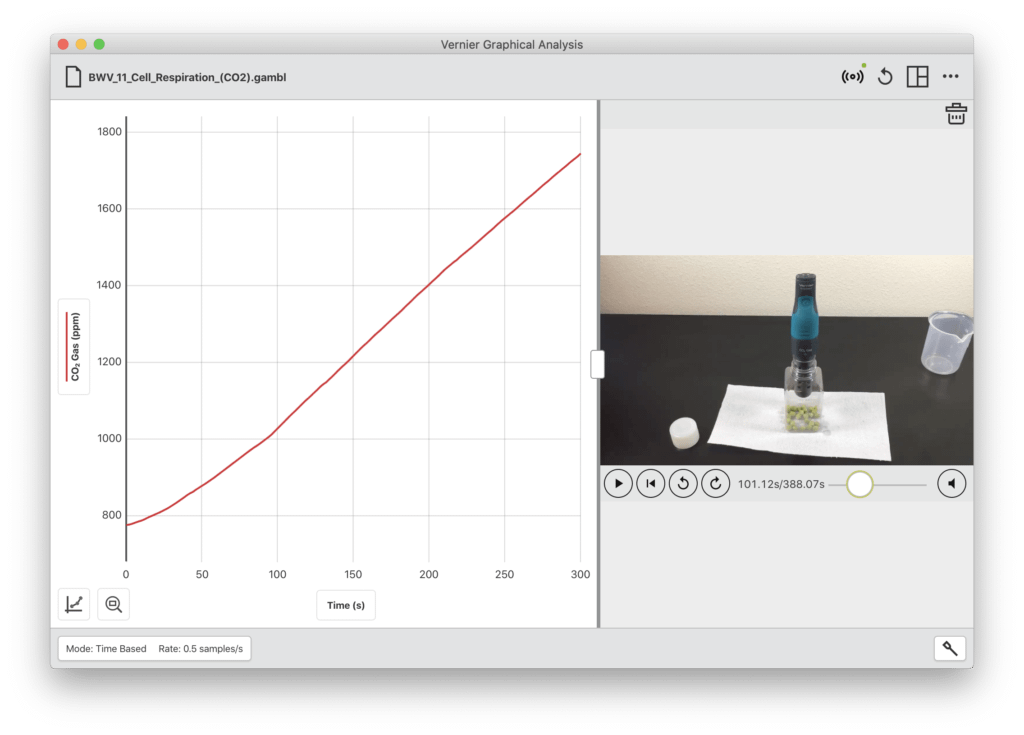
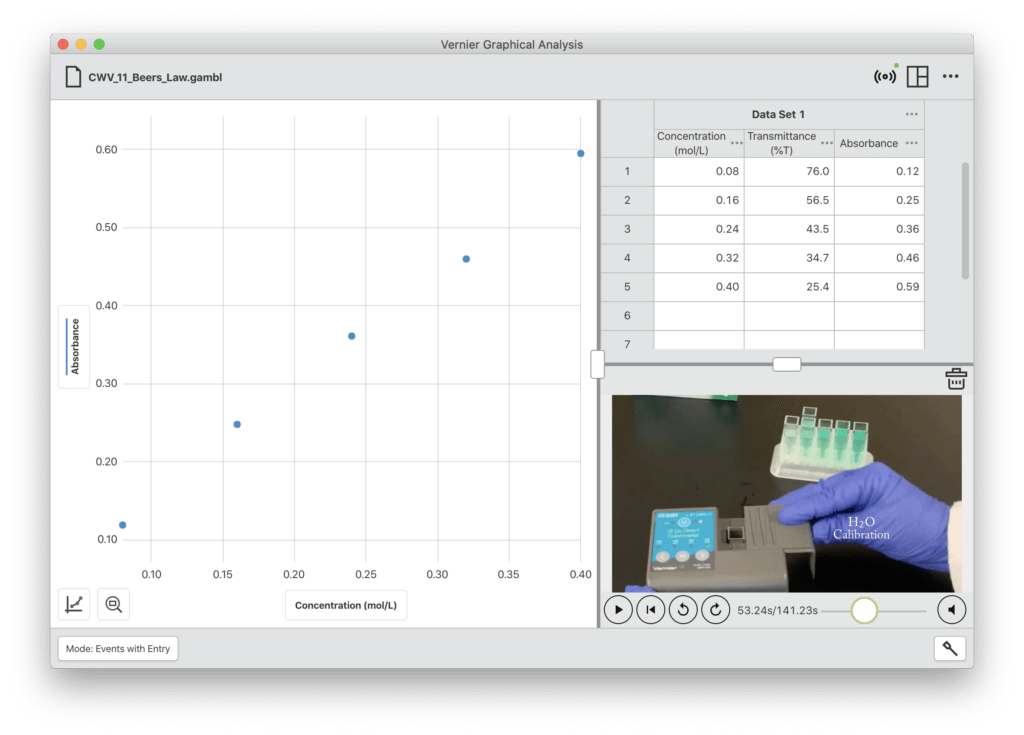
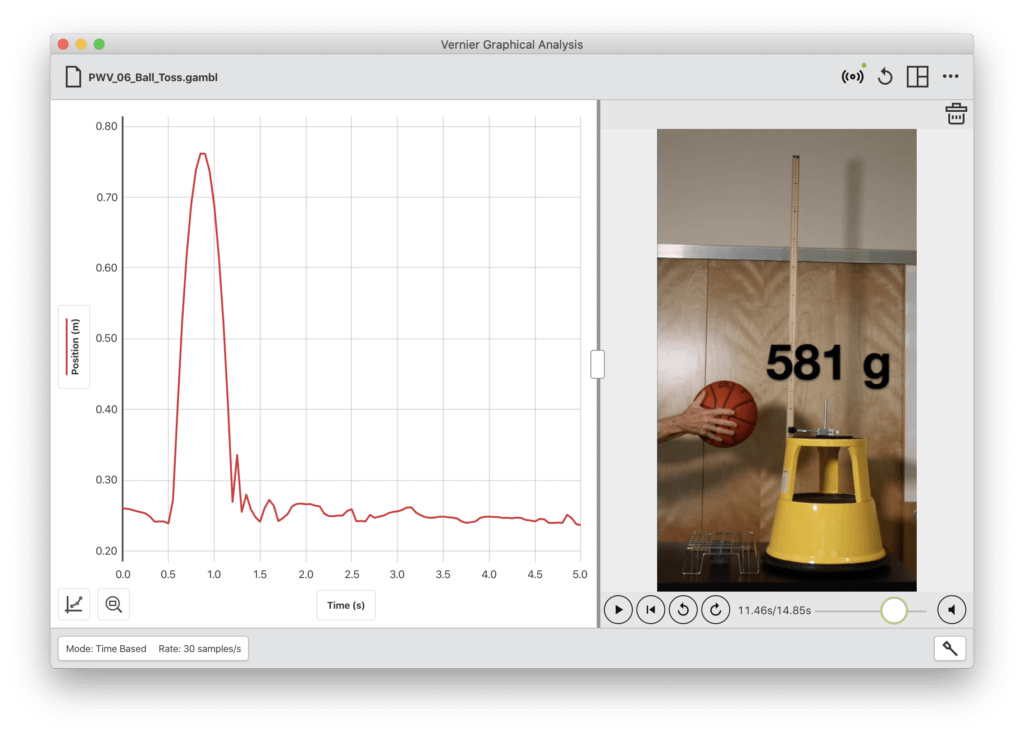
Graphical Analysis Pro gives access to dozens of sample experiments that come with data collected from real experiments. This means students watch videos of the experiments, then analyze the resulting data on their own. Seeing data collected right before their eyes gives students the ability to connect abstract concepts to real-world applications.
Best Practices
- Rather than projecting the sample experiment using a video conferencing tool, assign students to access the sample experiments on their own. This way students can see how the data were collected and then perform analysis on the data provided.
- Sample experiments from Graphical Analysis Pro feature embedded video files with synced data collection to aid in understanding the experimental setup.

3. Import Your Own Experiment Videos
With Graphical Analysis Pro, users who want to customize an experiment can capture a video of an experiment and import that video into the Graphical Analysis data file. Students can watch the video and watch the data redraw as if the data were being collected live.
Best Practices
- Use the Playback tool—an exclusive feature of Graphical Analysis Pro—to sync the data collection to the video.
- Share the file with students using Google Drive™, Dropbox, or a similar service.

Try Graphical Analysis Pro For Free
Graphical Analysis Pro is available for a free 30-day trial—try it out and inspire your students even as they learn from home.
Share this Article

Sign up for our newsletter
Stay in the loop! Beyond Measure delivers monthly updates on the latest news, ideas, and STEM resources from Vernier.


