Analyzing the Heart with EKG
Experiment #8 from Engineering Projects with NI LabVIEW and Vernier
- Subject
- Engineering
Introduction
An electrocardiogram (EKG) is a graphical recording of the electrical events occurring within the heart. In a healthy heart there is a natural pacemaker in the right atrium that initiates an electrical sequence. This impulse then passes down natural conduction pathways between the atria to the atrioventricular node and from there to both ventricles. The natural conduction pathways facilitate orderly spread of the impulse and coordinated contraction of first the atria and then the ventricles. The electrical journey creates unique deflections in the EKG that tell a story about heart function and health. Doctors and other trained personnel can look at an EKG tracing and see evidence for disorders of the heart such as abnormal slowing, speeding, irregular rhythms, injury to muscle tissue (angina), and death of muscle tissue (myocardial infarction). By looking at several beats, you can also calculate heart rate.
Objectives
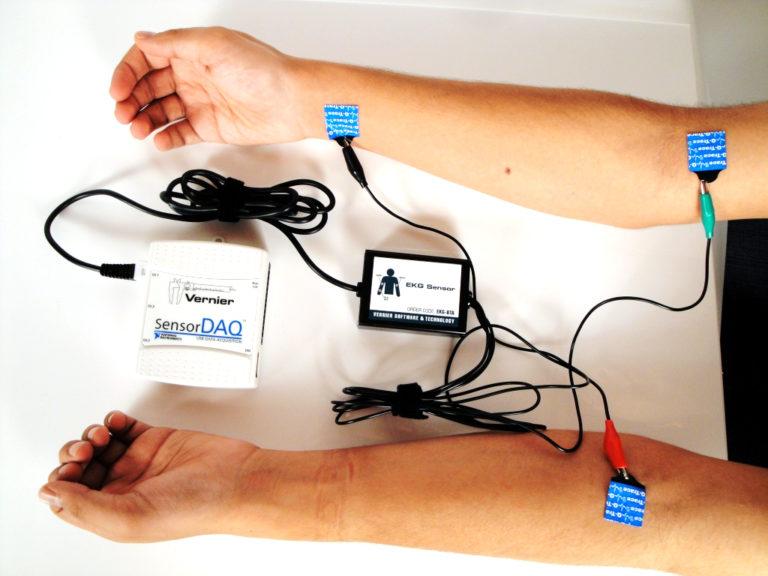
Write a LabVIEW program to graphically record an EKG tracing of heart activity. You will use a Vernier interface and an EKG Sensor for data collection with a sampling time of 10 seconds and a sampling rate of 100 samples per second. You should make two graphical displays — the first plotting the data in real time on a chart, and the second displaying the plot on a graph after all data have been collected. The second display should incorporate the graphical analysis tools available with the use of a Waveform Graph. After creating your VI, follow the steps in the Project Setup to properly attach the EKG to a test subject and run your program.
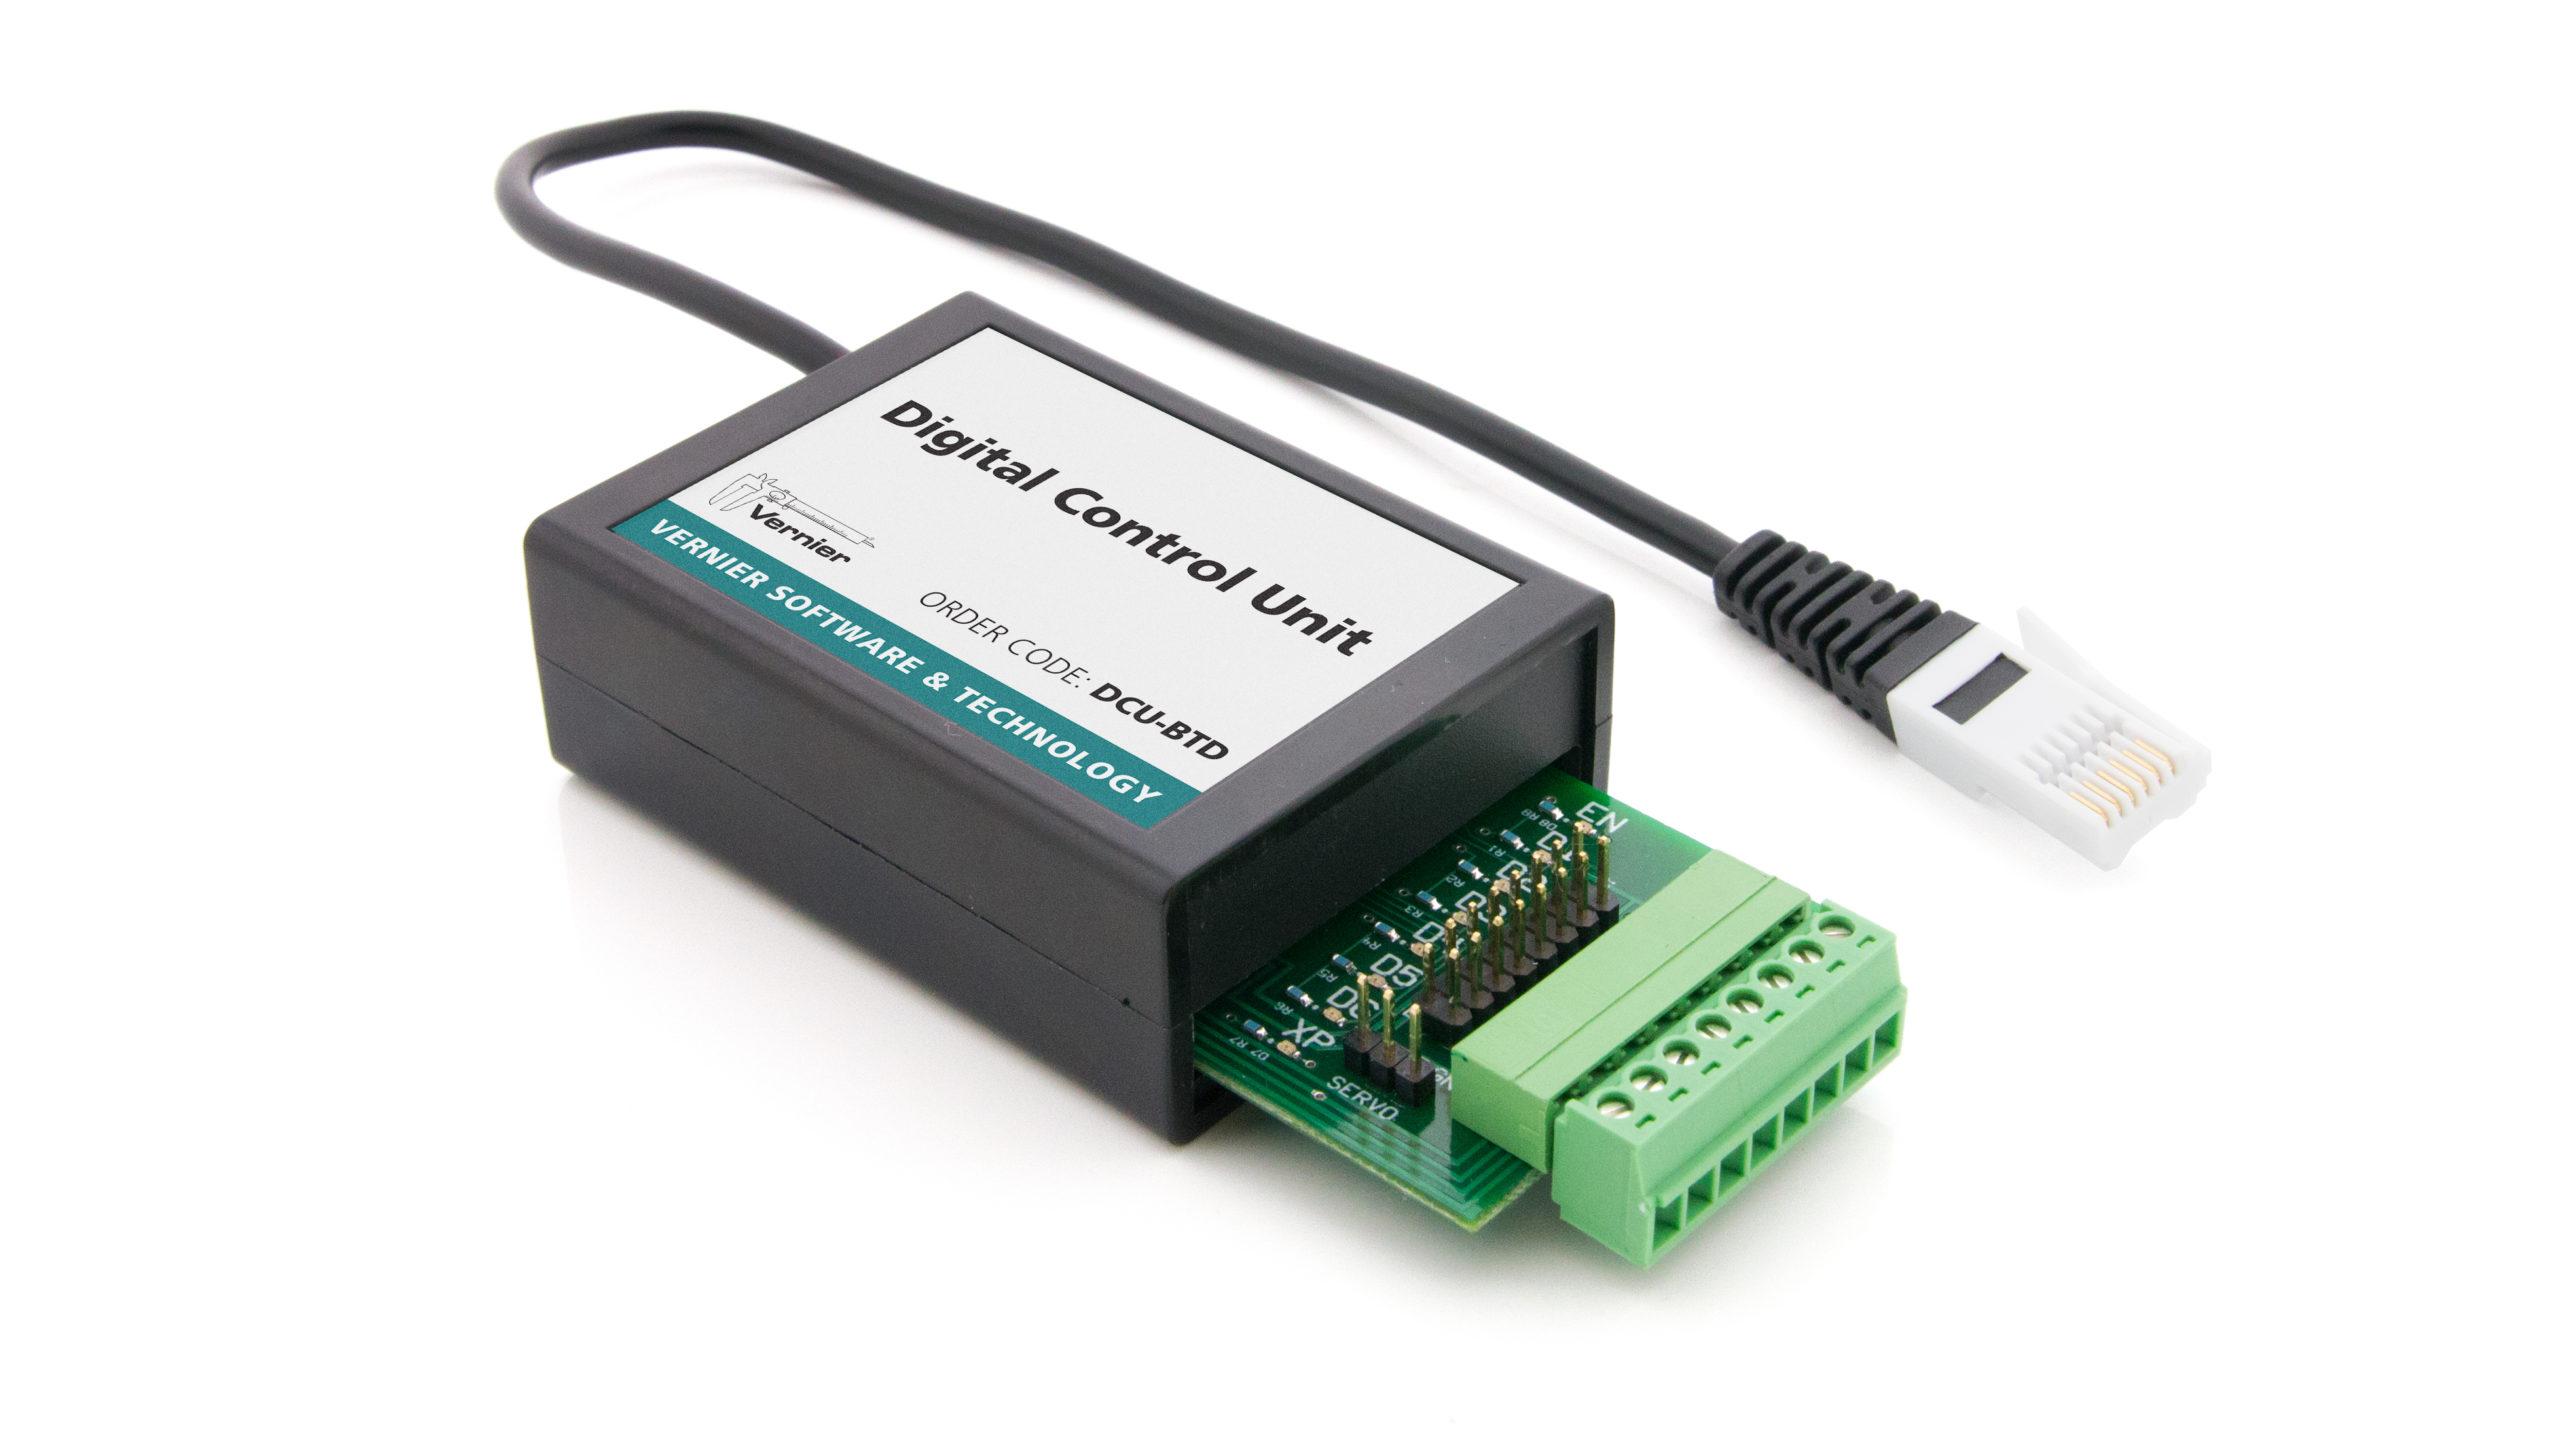
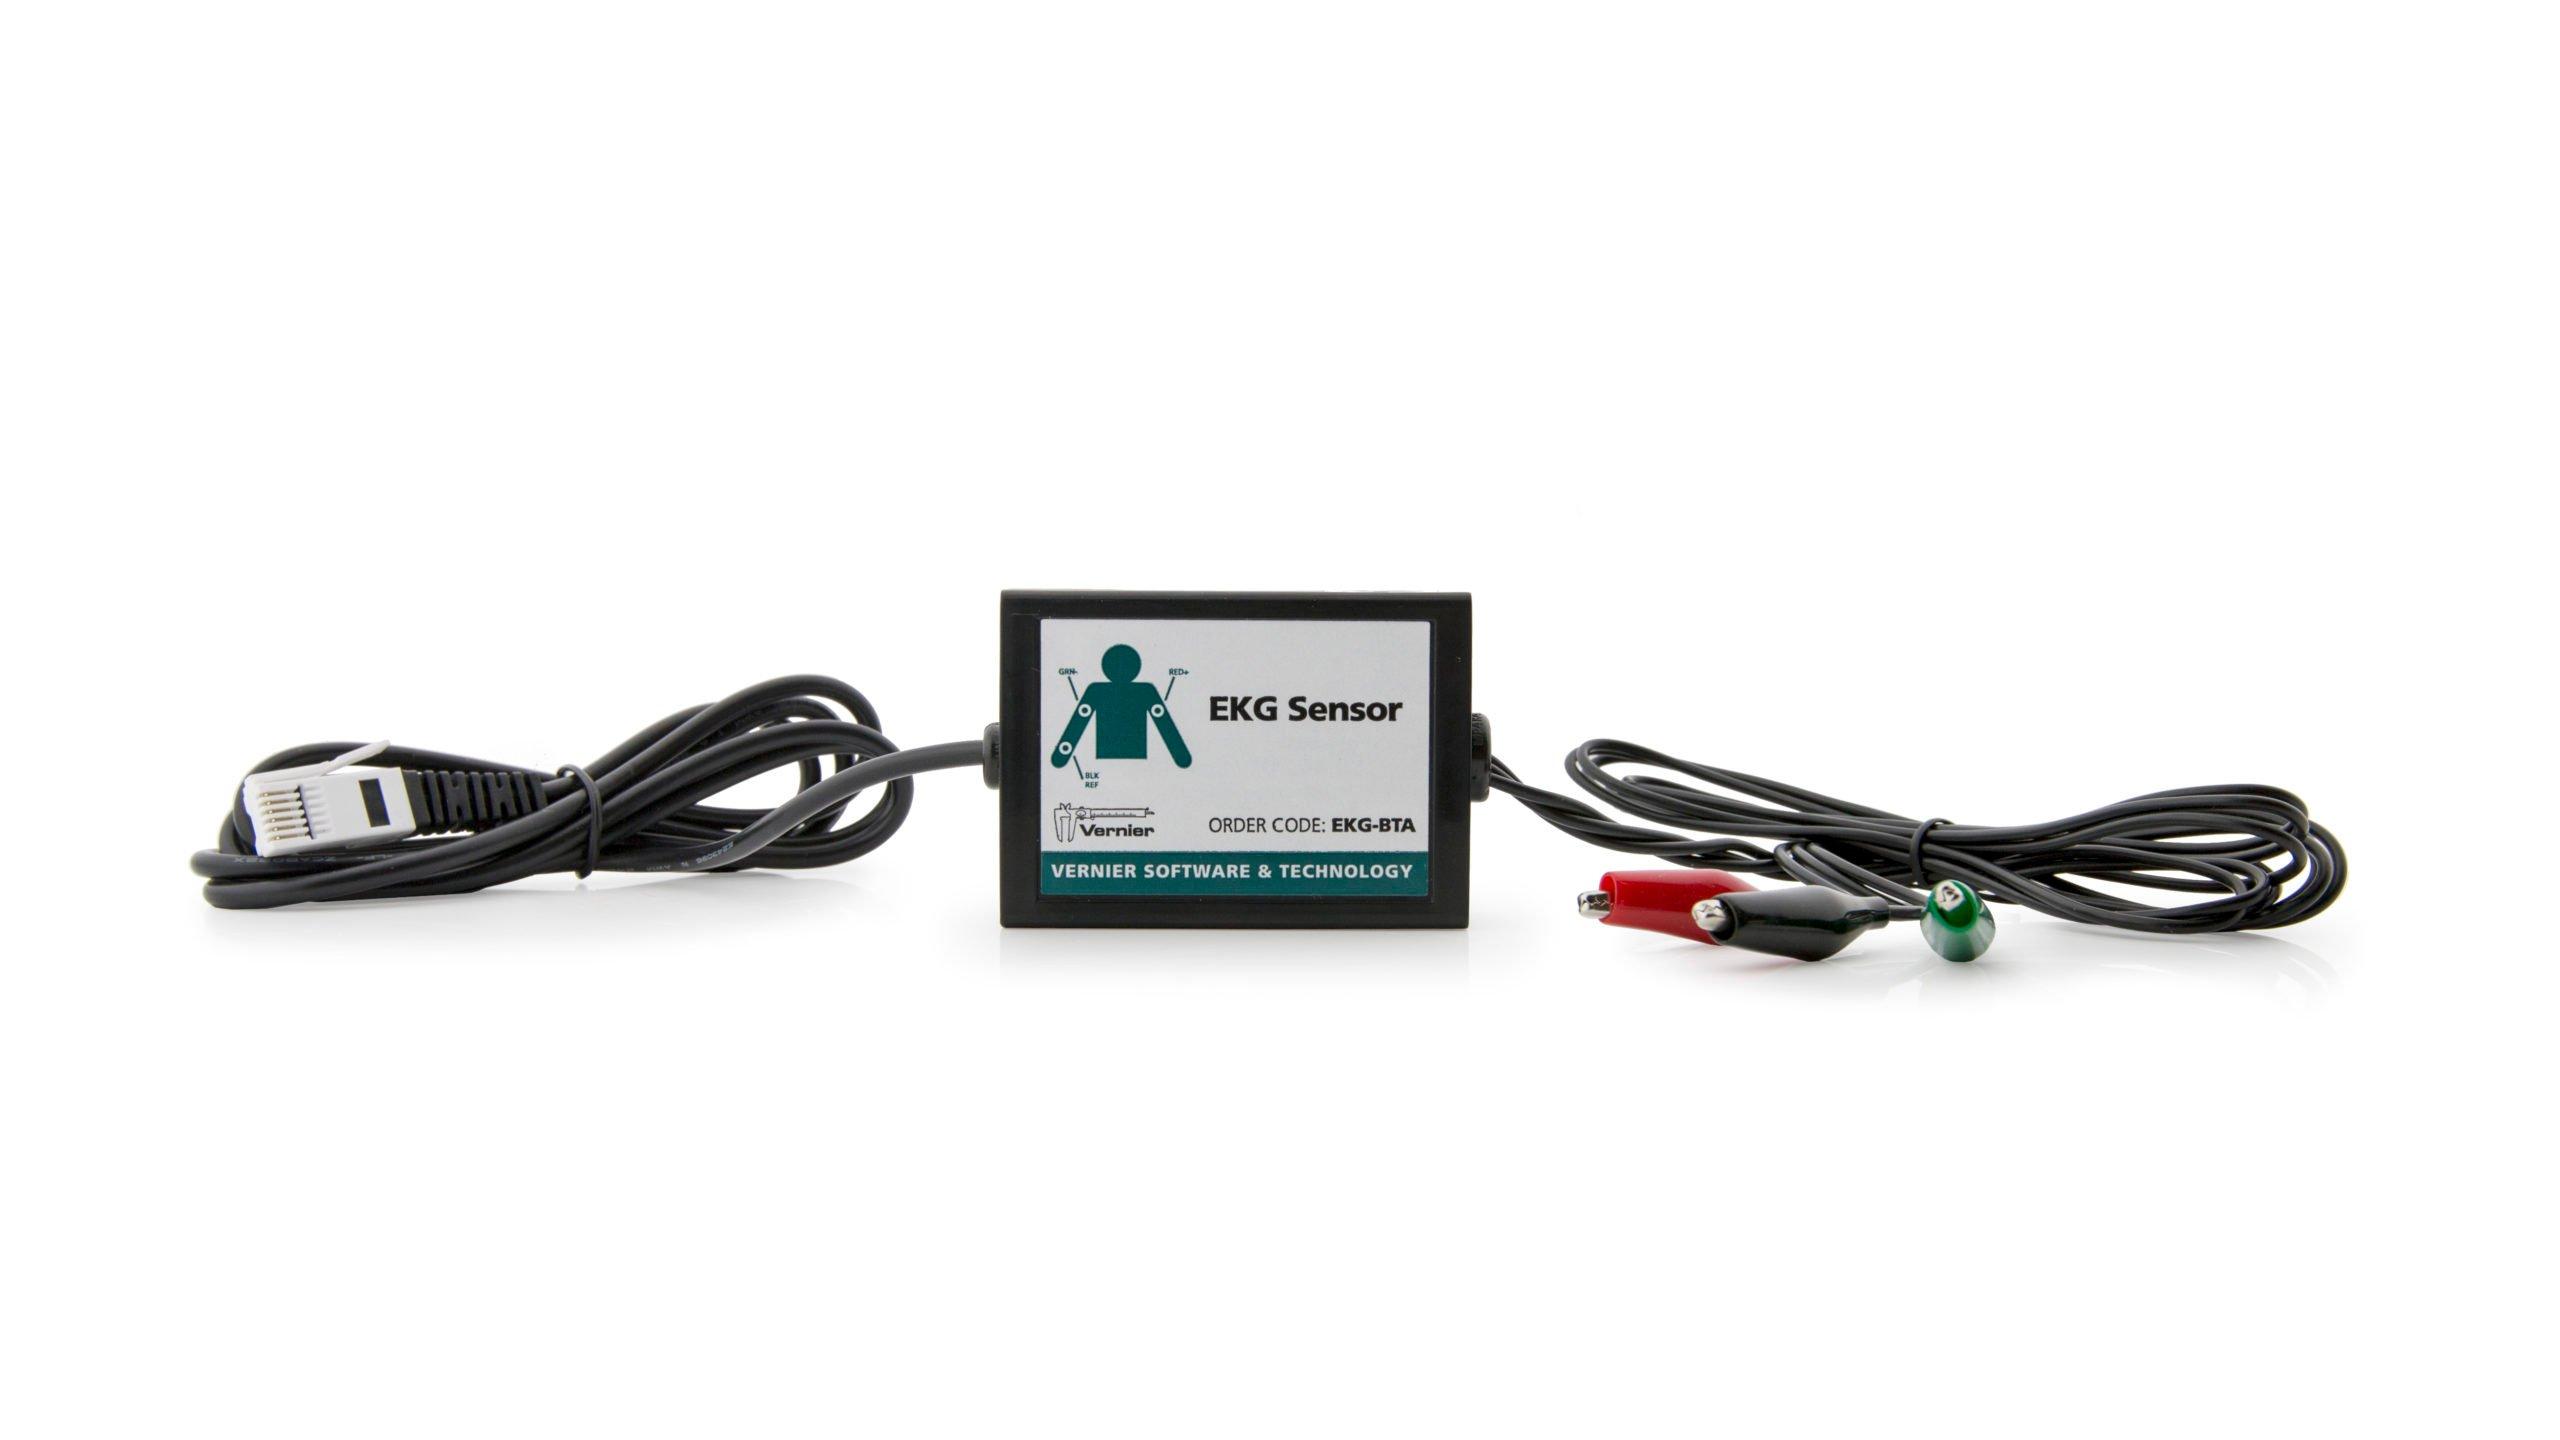
Sensors and Equipment
This experiment features the following sensors and equipment. Additional equipment may be required.
Ready to Experiment?
Ask an Expert
Get answers to your questions about how to teach this experiment with our support team.
- Call toll-free: 888-837-6437
- Chat with Us
- Email support@vernier.com
Purchase the Lab Book
This experiment is #8 of Engineering Projects with NI LabVIEW and Vernier. The experiment in the book includes student instructions as well as instructor information for set up, helpful hints, and sample graphs and data.