Introduction
You have no doubt been exposed many times to the Bohr model of the atom. You may have even learned of the connection between this model and bright line spectra emitted by excited gases. In this experiment, you will take a closer look at the relationship between the observed wavelengths in the hydrogen spectrum and the energies involved when electrons undergo transitions between energy levels.
Objectives
In this experiment, you will
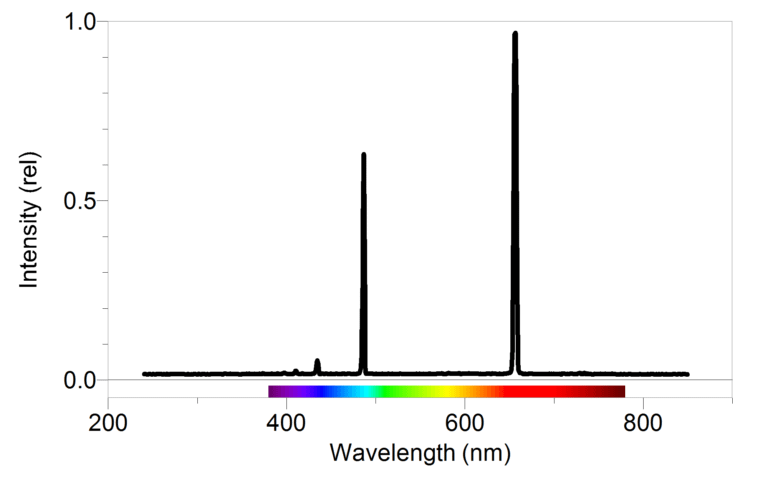
- Use a spectrometer to determine the wavelengths of the emission lines in the visible spectrum of excited hydrogen gas.
- Determine the energies of the photons corresponding to each of these wavelengths.
- Use a modified version of Balmer’s equation to relate the photons’ energies to specific transitions between energy levels.
- Use your data and the values for the electron transitions to determine a value for Rydberg’s constant for hydrogen.
Sensors and Equipment
This experiment features the following sensors and equipment. Additional equipment may be required.


Correlations
Teaching to an educational standard? This experiment supports the standards below.
- International Baccalaureate (IB)/Physics
- 7.1 Discrete energy and radioactivity
- International Baccalaureate (IB) 2025/Chemistry
- Structure 1.3.2—The line emission spectrum of hydrogen provides evidence for the existence of electrons in discrete energy levels, which converge at higher energies.
Ready to Experiment?
Ask an Expert
Get answers to your questions about how to teach this experiment with our support team.
- Call toll-free: 888-837-6437
- Chat with Us
- Email support@vernier.com
Purchase the Lab Book
This experiment is #21 of Advanced Physics with Vernier — Beyond Mechanics. The experiment in the book includes student instructions as well as instructor information for set up, helpful hints, and sample graphs and data.