By Colleen McDaniel
The environmental community certainly has its hands full with all the issues facing our planet today. While climate change is a popular issue, many related, yet commonly overlooked problems in the ocean, particularly ocean acidification, are becoming increasingly hot topics.
Now, with World Oceans Day coming up on June 8th, you have a great opportunity to focus your students’ attention on our oceans by engaging them in an investigation that highlights how life in the ocean is impacted by changes in the environment.
Real-World Applications
Experiments with real-world applications are important because they help demonstrate to students the reality behind the science. As a biologist and former AP Environmental Science teacher, I know from experience that these kinds of experiments help open students’ eyes to real environmental issues and can inspire students to further research these issues and take action.
The Problem with Ocean Acidification
Ocean acidification is an issue that impacts every organism in the ocean. Many people think that ocean acidification is caused by climate change, but the truth is that acidification is caused by the same thing that causes climate change—increasing levels of carbon dioxide. Though it’s common for people to concentrate on the devastating effects of acidification on coral populations, the effect of acidification on the food chain, starting with plankton, has even greater implications.
Plankton build their calcium carbonate shells from available calcium and carbonate ions in the surrounding water. With an average pH of 8.1, ocean water is alkaline and can hold relatively high concentrations of carbonate. When increased amounts of carbon dioxide are absorbed by the ocean, the shift in equilibrium causes an increase in the concentration of H+ in the water (making the water more acidic) and a decrease in the concentration of CO32-. In response to these changes, plankton are migrating to locations with better conditions. Organisms that rely on plankton as a food source must follow along, or they will starve. Since plankton is at the bottom of the food chain in the ocean and almost every organism in the ocean relies on plankton in one way or another, the effects of this acidification are wide and far reaching. This is where a hands-on activity to demonstrate just how the addition of carbon dioxide decreases pH levels in water can come in especially useful when exploring these concepts with your students.
Hands-On Experiment to Show pH Change
A common experiment conducted in student laboratories involves students exhaling into a sample of water containing bromothymol blue, a pH indicator. As the students exhale into the sample, the indicator changes from blue to yellowish green, indicating a decrease in pH levels. This is an effective, qualitative way to show a pH change, but there is also an easy way to use a pH sensor to record quantitative data. Replacing or augmenting the use of the indicator with the collection of quantitative data offers students a new perspective on the experiment.
While students often enjoy using a straw to blow air into a water sample, they can get lightheaded and, unless they are using biodegradable straws, students are using materials that contribute to pollution. An alternative technique increases carbon dioxide concentration in a sample of ocean water by placing dry ice in a vacuum flask that has a tube leading into the sample. As the dry ice sublimates, carbon dioxide gas is released and bubbles into the water.
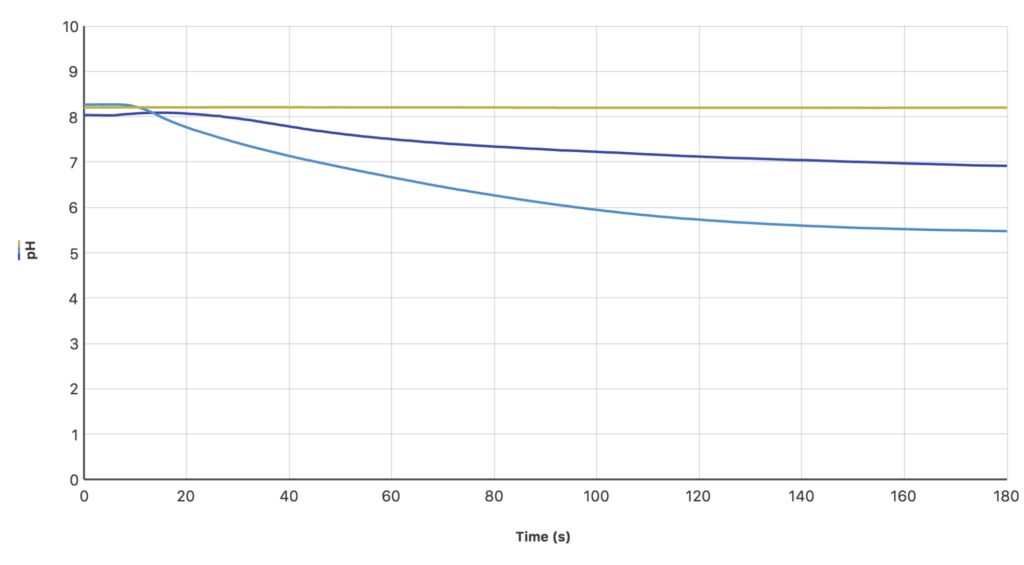
I used the Go Direct® pH Sensor to research the effectiveness of using an aquarium aerator, human breath, and dry ice to introduce carbon dioxide to a sample of ocean water. With an aerator, no change in pH was measured (yellow line on the graph), because no excess carbon dioxide was introduced into the ocean water. Human breath did cause a gradual decrease in pH (dark blue line on the graph), since exhaled air is mostly carbon dioxide. The dry ice, releasing only carbon dioxide, caused the pH to drop dramatically and steadily over time (light blue line on the graph).

There are undoubtedly many other experiments out there that address and demonstrate ocean acidification. We love to hear about any new ideas, so don’t hesitate to share your experiment ideas by tagging us on Twitter or Facebook (@VernierST).
Want to take these experiment ideas even further? Vernier offers student-ready experiments in a wide variety of subjects, and our data-collection technology is so versatile that it can be used in nearly all scientific disciplines. Help your students gain practical, relevant data-collection and analysis experience that they can use wherever they go next.
