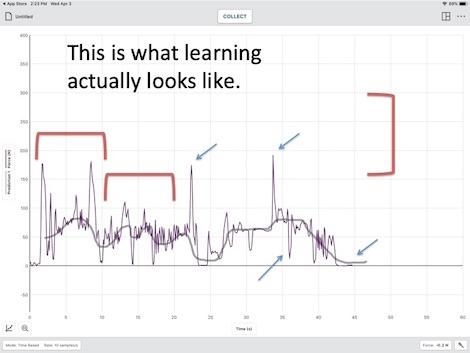
Martin Horejsi of NSTA Recommends provides helpful tips for teaching students to visualize data in his article, “Learning Visualized with the Vernier Go Direct® Hand Dynamometer.” Martin instructs students to first draw a prediction and then offers students the opportunity to trace the prediction by squeezing a Go Direct Hand Dynamometer, which measures grip strength. The force of the student’s grip is displayed in real-time in Graphical Analysis™ 4 on their device.
As students become more familiar with the response of the sensor and the visualization of this data, their graph becomes more refined and starts to resemble their prediction.
“Other sensors also offer similar opportunities for learning how to ‘be the graph,’ including the Go Direct Motion Detector.” Martin explains, “But no matter what you use or how you use it, the application of a digital sensor with real-time data graphing will also create visible learning in real time.”
Martin continues to describe the features and functionality of the Go Direct Hand Dynamometer and provides sample strength and muscle fatigue studies that students can complete using the technology. Go Direct Hand Dynamometer is part of the Go Direct family of sensors, which offers educators and students maximum versatility to collect scientific data either wirelessly or via a USB connection. Affordable and durable, Go Direct sensors can be used in more than 300 teacher-tested experiments developed by Vernier and are supported by ourfree graphing and analysis software, Graphical Analysis™ 4.
Read the complete review of the Go Direct Hand Dynamometer on NSTA Recommends »