Attention: Safety Recall of Vernier Go Direct Charge Station. Click to learn more.

Shop

Vernier Spectral Analysis® Support

Software Update

Download the latest update to Spectral Analysis for enhancements, bug fixes, and new features.

  • Windows
  • Mac

User Manual

Download our full user manual for an overview and instructions on the features in Spectral Analysis.

Sample Experiment Downloads

Nickel sulfate Beer’s law (absorbance)
Crystal violet kinetics (absorbance)
Absorbance spectrum of green food coloring
Riboflavin fluorescence spectrum
Hydrogen gas emission spectrum
Quinine absorbance and fluorescence spectra

Screencasts

Select a Region

Select a region for data analysis.

  1. Click or tap and drag across the graph to select a region.
  2. If needed, drag the boundary lines to resize the region.

Apply a Curve Fit to a Selected Region

Analyze a selection of your data.

  1. Select a region.
  2. Click or tap the Graph Tools button.
  3. Select a curve fit model.
  4. Click or tap Apply or somewhere outside the selection tool to view the equation.

Apply a Curve Fit to All Data

Analyze data in the region defined by the graph’s x-axis range.

  1. Click or tap the Graph Tools button.
  2. Select a curve fit model.
  3. Click or tap Apply or somewhere outside the selection tool to view the equation.

Note: Data having x-coordinates within the graph’s x-range will be included in the analysis even if they are not plotted on the graph.

Calculate Statistics

Find the mean, standard deviation, minimum, and maximum values of the data.

  1. Click or tap the Graph Tools button.
  2. Select Statistics.
  3. If needed, scroll the text in the Statistics dialog to view all of the information.

Note: You can also calculate statistics for a portion of the data by first selecting a region.

Plot Data from Multiple Data Sets

Add or remove the columns of data plotted on any graph.

  1. Click or tap the y-axis label to display the selection popover.
  2. Click or tap a column to add or remove it from the graph.
  3. Click or tap off of the popover to dismiss the tool.

Create a Calculated Column

  1. Click or tap the options button (ᐧᐧᐧ) in one of the table columns.
  2. Select Add Calculated Column.
  3. Modify the Name, Units and Displayed Precision as desired.
  4. Click or tap Insert Expression and select the desired expression.
  5. Modify the expression as necessary
  6. Click or tap Apply.

Note: When the data column upon which the calculated column is based is plotted, the graph will update to show the new calculated column instead.

Supported Instrumentation

The Go Direct® SpectroVis® Plus Spectrophotometer quickly measures a full wavelength spectrum. It connects via Bluetooth® wireless technology or via USB to your device.

The Go Direct® UV-VIS Spectrophotometer connects to your device via Bluetooth® wireless technology or USB to generate full spectra, Beer’s law data, and kinetic traces of ultraviolet and visible-absorbing samples (such as aspirin, DNA, proteins, and NADH). 

The Go Direct® Fluorescence/UV-Vis Spectrophotometer measures fluorescence and absorbance spectra of myriad samples, such as quinine sulfate, fluorescein, chlorophyll, and fluorescent proteins, all while connecting to your device via Bluetooth® wireless technology or USB.

The Go Direct® Emissions Spectrometer enables students to conduct emissions analysis; measure spectra of light-emitting samples in the range of 350 to 950 nm; and examine emissions spectra of light bulbs, spectrum tubes, or the sun. 

About Spectral Analysis


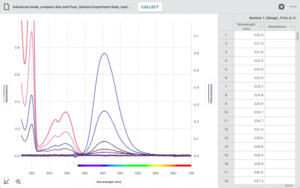
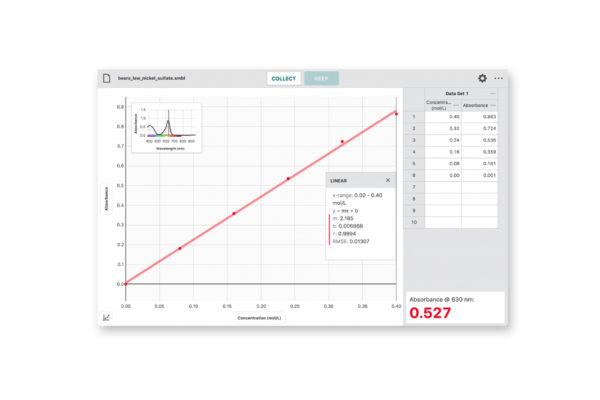
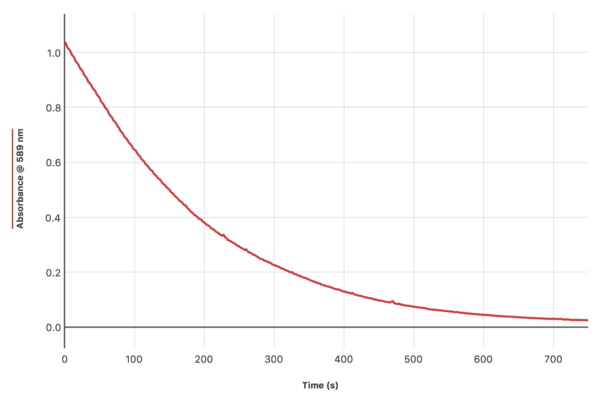
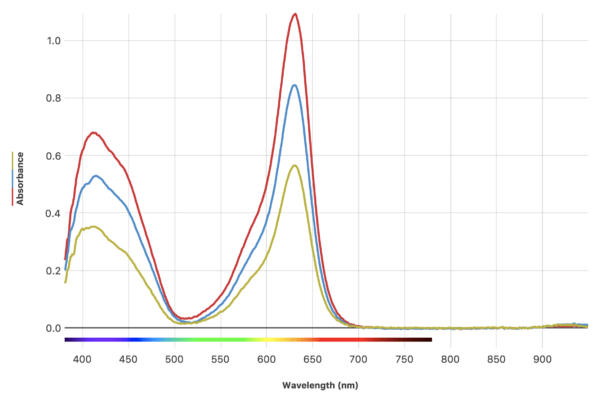
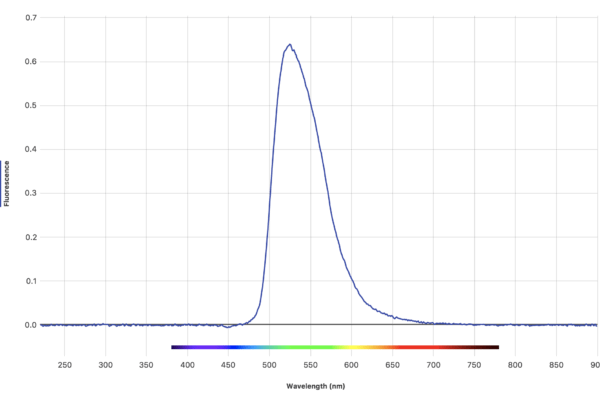
Our free Spectral Analysis app makes it easy to incorporate spectroscopy into your biology and chemistry labs. Using the app, students can collect a full spectrum and explore topics such as Beer’s law, enzyme kinetics, and plant pigments. Learn more about Spectral Analysis »

Contact Vernier Support

Need more assistance? Fill out our online support form or call us toll-free at 1-888-837-6437.

SAVE/SHARE YOUR CART