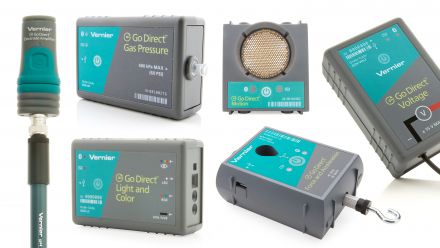
Learn how to connect a Go Direct sensor to your data-collection platform. Select the appropriate tab to view connection instructions for your specific platform.
Before you begin, you will need to download and install Graphical Analysis.
Note: Go Direct sensors cannot be used with our Logger Pro 3 or Logger Lite software.
 Graphical Analysis and Graphical Analysis Pro
- Ensure your sensor is charged or connected to a power source.
- Turn on your sensor by pressing the power button once.
- The Bluetooth LED will blink red.
- Launch Graphical Analysis.
- Click or tap
 from the New Experiment list.
 - Click or tap your Go Direct sensor from the list of Discovered Wireless Devices.
- Your sensor’s ID is located near the barcode on the sensor label.
- You can type part of your sensor’s ID in the
 to quickly find your sensor.
 - You can use
 to connect to your sensor automatically. This feature assumes your sensor is the one with the strongest Bluetooth signal.
 - The Bluetooth LED on the sensor will blink green when it is successfully connected.
- If your sensor has multiple sensor channels, follow these instructions to change the default settings.
- Click or tap
 .
. - Select the sensor channels you want to use.
- Click or tap
- Click or tap
 .
. - The app will load a default data-collection setup. You are now ready to continue your experiment.
- Connect the sensor to the USB port of the computer.
- Launch Graphical Analysis.
- The app will load a default data-collection setup.
- If your sensor has multiple sensor channels, follow these instructions to change the default settings.
- Click or tap Sensor Setup,
 .
. - Click or tap .
- Select the sensor channels you want to use.
- Click or tap .
- Click or tap Sensor Setup,
- You are now ready to continue your experiment.
Before you begin, you will need to make sure your browser software is up to date. Once updated, launch Graphical Analysis by going to the following URL:
Note: Compatible browsers include Chrome and Edge. Safari and Firefox are not supported. Chrome on an iPhone/iPad is not supported.
Graphical Analysis and Graphical Analysis Pro
- Ensure your sensor is charged or connected to a power source.
- Turn on your sensor by pressing the power button once.
- The Bluetooth LED will blink red.
- Launch Graphical Analysis.
- Click or tap from the New Experiment list.
- Click or tap
 , select your Go Direct sensor from the list of Discovered Wireless Devices, then click or tap Pair.
- Your sensor’s ID is located near the barcode on the sensor label.
- The Bluetooth LED on the sensor will blink green when it is successfully connected.
- If your sensor has multiple sensor channels, follow these instructions to change the default settings.
- Click or tap .
- Select the sensor channels you want to use.
- Click or tap
- Click or tap .
- The app will load a default data-collection setup. You are now ready to continue your experiment.
Additional information:
How do I connect Bluetooth sensors to the Progressive Web App version of Graphical Analysis?
- Connect the sensor to the USB port of the computer or Chromebook.
- Launch Graphical Analysis.
- Click or tap from the New Experiment list.
- Click or tap
 , then select
  .
. - Select Go Direct Sensor from the list of discovered USB (HID) devices, then click or tap Connect.
- If your sensor has multiple sensor channels, follow these instructions to change the default settings.
- Click or tap Sensor Setup, .
- Click or tap
- Select the sensor channels you want to use.
- Click or tap, .
- Click or tap Sensor Setup,
- The app will load a default data-collection setup. You are now ready to continue your experiment.
Additional information:
How do I connect USB sensors to the Progressive Web App version of Graphical Analysis?
Before you begin, you will need to download and install Graphical Analysis.
Note: You cannot use the ![]() Google Play version of Graphical Analysis on a Chromebook for sensor data collection.
Google Play version of Graphical Analysis on a Chromebook for sensor data collection.
Graphical Analysis and Graphical Analysis Pro
- Ensure your sensor is charged or connected to a power source.
- Turn on your sensor by pressing the power button once.
- The Bluetooth LED will blink red.
- Launch Graphical Analysis.
- Click or tap from the New Experiment list.
- Click or tap your Go Direct sensor from the list of Discovered Wireless Devices.
- Your sensor’s ID is located near the barcode on the sensor label.
- You can type part of your sensor’s ID in the to quickly find your sensor.
- You can use to connect to your sensor automatically. This feature assumes your sensor is the one with the strongest Bluetooth signal.
- The Bluetooth LED on the sensor will blink green when it is successfully connected.
- If your sensor has multiple sensor channels, follow these instructions to change the default settings.
- Click or tap .
- Select the sensor channels you want to use.
- Click or tap
- Click or tap .
- The app will load a default data-collection setup. You are now ready to continue your experiment.
- Connect the sensor to the USB port of the Chromebook.
- Launch Graphical Analysis.
- The app will load a default data-collection setup.
- If your sensor has multiple sensor channels, follow these instructions to change the default settings.
- Click or tap Sensor Setup, .
- Click or tap
- Select the sensor channels you want to use.
- Click or tap, .
- Click or tap Sensor Setup,
- You are now ready to continue your experiment.
Before you begin, you will need to download and install Graphical Analysis.
Note: We do not recommend using Go Direct sensors with Graphical Analysis GW.
Graphical Analysis and Graphical Analysis Pro
- Ensure your sensor is charged or connected to a power source.
- Turn on your sensor by pressing the power button once.
- The Bluetooth LED will blink red.
- Launch Graphical Analysis.
- Tap from the New Experiment list.
- Tap your Go Direct sensor from the list of Discovered Wireless Devices.
- Your sensor’s ID is located near the barcode on the sensor label.
- You can type part of your sensor’s ID in the to quickly find your sensor.
- You can use to connect to your sensor automatically. This feature assumes your sensor is the one with the strongest Bluetooth signal.
- The Bluetooth LED will blink green when it is successfully connected.
- If your sensor has multiple sensor channels, follow these instructions to change the default settings.
- Tap .
- Select the sensor channels you want to use.
- Tap
- Tap .
- The app will load a default data-collection setup. You are now ready to continue your experiment.
Connecting via USB is not supported on this platform.
Before you begin, you will need to download and install Graphical Analysis. In order to connect to a sensor, you must turn on the Location Permission.
Note: Go Direct sensors are not supported on Graphical Analysis GW.
Graphical Analysis and Graphical Analysis Pro
- Ensure your sensor is charged or connected to a power source.
- Turn on your sensor by pressing the power button once.
- The Bluetooth LED will blink red.
- Launch Graphical Analysis.
- Click or tap from the New Experiment list.
- Click or tap your Go Direct sensor from the list of Discovered Wireless Devices.
- Your sensor’s ID is located near the barcode on the sensor label.
- You can type part of your sensor’s ID in the to quickly find your sensor.
- You can use to connect to your sensor automatically. This feature assumes your sensor is the one with the strongest Bluetooth signal.
- The Bluetooth LED on the sensor will blink green when it is successfully connected.
- If your sensor has multiple sensor channels, follow these instructions to change the default settings.
- Click or tap .
- Select the sensor channels you want to use.
- Click or tap
- Click or tap .
- The app will load a default data-collection setup. You are now ready to continue your experiment.
Connecting via USB is not supported on this platform.
Before you begin, make sure you are running the latest version of the LabQuest App.
 LabQuest App
- Ensure your sensor is charged or connected to a power source.
- Turn on your sensor by pressing the power button once.
- The Bluetooth LED will flash red.
- Ensure your LabQuest is charged or connected to AC power.
- Turn on LabQuest and choose New from the File menu.
- Choose Wireless Device Setup > Go Direct… from the Sensors menu.
- Choose your sensor from the list of discovered devices and tap OK.
- The app will identify the sensor and load a default data-collection setup.
- The Bluetooth LED on the sensor will blink green when it is successfully connected.
- If your sensor has multiple sensor channels, follow these instructions to change the default settings.
- Tap the sensor meter and select Sensor Channel…
- Select the sensor channels you would like use.
- Tap OK to exit the sensor channel setup.
- You are now ready to continue your experiment.
- Ensure your LabQuest is charged or connected to AC power.
- Turn on LabQuest and choose New from the File menu.
- Connect your sensor to the USB port on LabQuest.
- The app will identify the sensor and load a default data-collection setup.
- If your sensor has multiple sensor channels, follow these instructions to change the default settings.
- Tap the sensor meter and select Sensor Channel…
- Select the sensor channels you would like use.
- Tap OK to exit the sensor channel setup.
- You are now ready to continue your experiment.
Data Sharing lets you stream data collected on a LabQuest 2 or LabQuest 3 to multiple devices that are running Graphical Analysis or Graphical Analysis Pro. Your LabQuest must be on the same Wi-Fi network as your devices.
- Connect the sensor to your LabQuest via USB or wireless Bluetooth connection as described above.
- Enable Data Sharing on LabQuest.
- Launch Graphical Analysis on the device you wish to Data Share with.
- Click or tap

- Choose your LabQuest from the list of discovered Data Sharing sources.
- If your version of Graphical Analysis has the Graphical Analysis Pro features unlocked, select the Local data sharing option to see the list of devices.
- If your LabQuest does not show up in the list, click or tap
 and enter the IP address of the LabQuest.
- The app will connect to LabQuest. You are now ready to continue your experiment.
Note: LabQuest cannot receive data via Data Sharing, it can only act as a Data Sharing source.
Related Links
- Connection Instructions for LabQuest (BTA and BTD) Sensors
- Connection Instructions for Spectrometers
- How do I use Vernier USB products with a computer or Chromebook having only USB-C ports?
- How do I connect USB sensors to the Progressive Web App version of Graphical Analysis?
- How do I connect Bluetooth sensors to the Progressive Web App version of Graphical Analysis?


