By Bill Berner, University of Pennsylvania
Department of Physics & Astronomy

The equation that characterizes kinetic friction is not hard to evaluate with measured data. But the normal force and frictional resistance are usually measured at two different times and only brought together later in the equation. While this approach yields workable numbers, it presents friction as a number rather than a process. By measuring these two forces simultaneously and in real time, the cause and effect nature of the friction process is hard to miss.
Kinetic friction can be measured by pulling an object at a constant velocity with a Dual‑Range Force Sensor. With no acceleration, the zero‑net-force condition means the force applied by pulling the force sensor must equal the resistance of friction. This has the added benefit of revisiting the concept of net force. If the object is pulled across a Vernier Force Plate, the normal force can be recorded simultaneously.

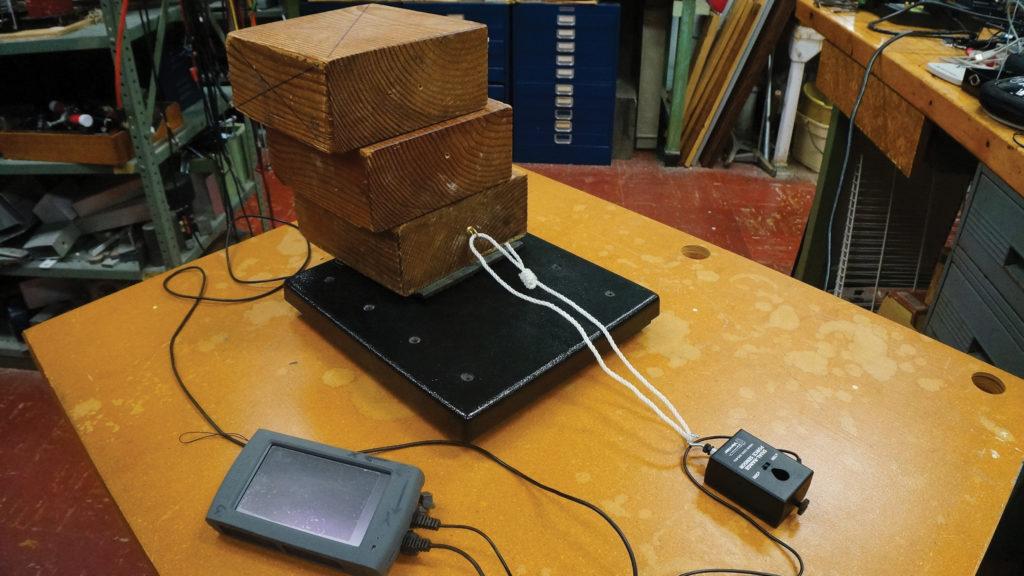
The objects pulled should be stackable blocks less than half the dimension of the plate, and the friction can be made more repeatable by sticking a felt furniture slider to the bottom block. The three-block strategy enables adding or removing masses while dragging. This introduces changes into the graphs of both the pulling force (friction) and the normal force. Force sensors should be zeroed with no loads to ensure valid calculations. A little practice ahead of time will let you get your speeds and times right.
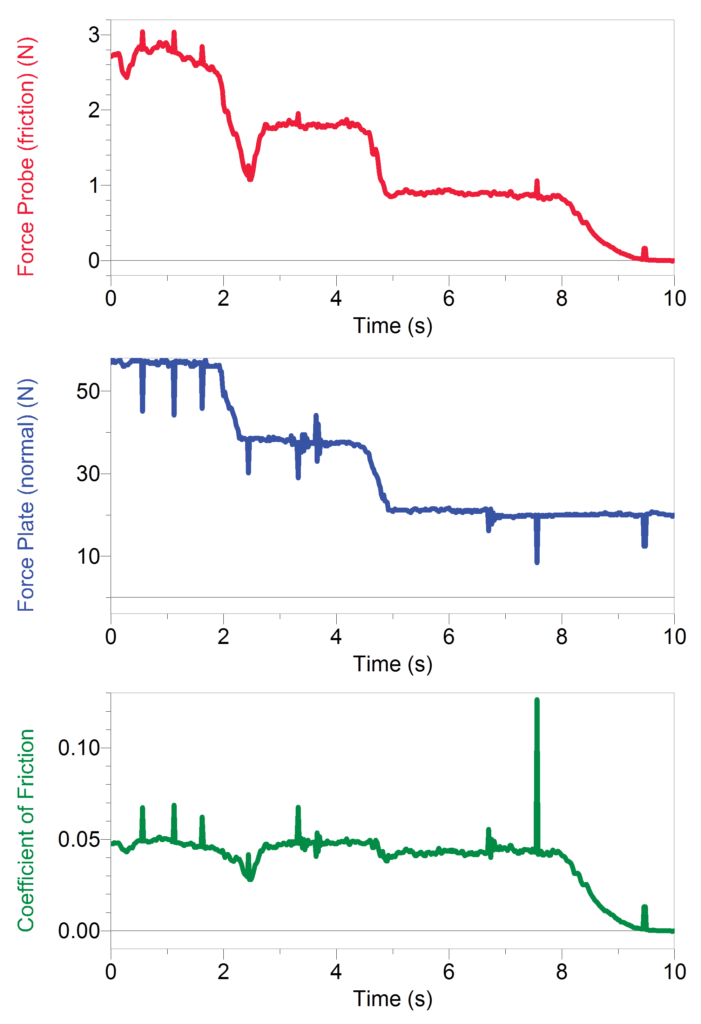
Before collecting data, insert a calculated column equal to the ratio of the two forces; that is, the coefficient of kinetic friction. Doing this live clarifies the relationship between the measurements and the standard expression for kinetic friction. The graph of the calculated column is inserted below the other two force graphs. It shows all the important features of a “coefficient”: it remains constant while its parameters vary (by a factor of three in this case), and the units of its parameters cancel leaving the coefficient dimensionless.
Because space and time are limited for the block changes, it is hard to do with any finesse. It’s tough to match the motion of the added block to the moving block, and big force spikes occur. This problem is easier to avoid if blocks are removed rather than added. Starting with three blocks and removing them one at a time as the stack is dragged across the Force Plate produces cleaner data. As can be seen in the photo, the blocks are stacked with slight overhangs to make them easier to remove. The graph shows that some spikes are unavoidable, but the fundamental behavior is clear. By changing surfaces, materials, and inclines this procedure could expand to a full lab or an independent student project.
