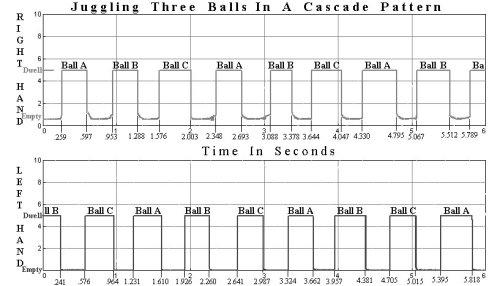
Check out www.jug.net/wt/jgpl.htm for a remarkably complete collection of information about the science of juggling. William V. Thayer, (St. Louis CC at Meramec, Kirkwood, MO) even includes this sample graph made with Logger Pro showing the position of the balls during a juggling session. He made this graph using special gloves with aluminum-foil strips wired so that if adjacent strips were shorted out, the voltage goes to five volts. He then juggled metal-coated balls, reading the voltage from each glove using Logger Pro. From the information in this graph, you can find the time that the ball stays in the hand, the height of each toss, and lots of other interesting information.