Effect of Temperature on Solubility of a Salt
Experiment #12 from Chemistry with Vernier
- Education Level
- High School
- Subject
- Chemistry
Introduction
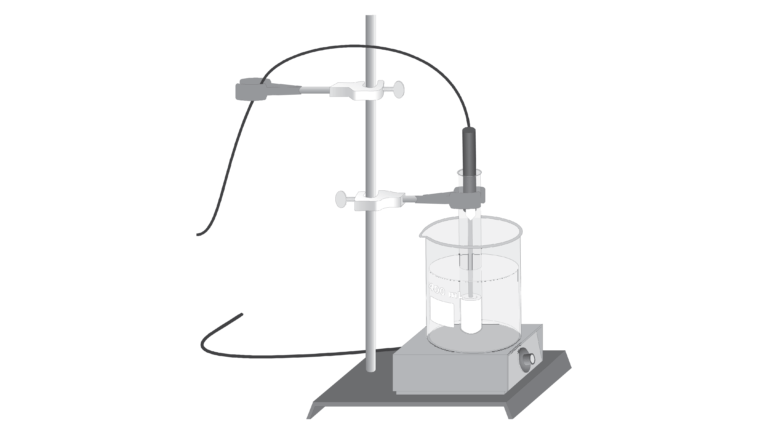
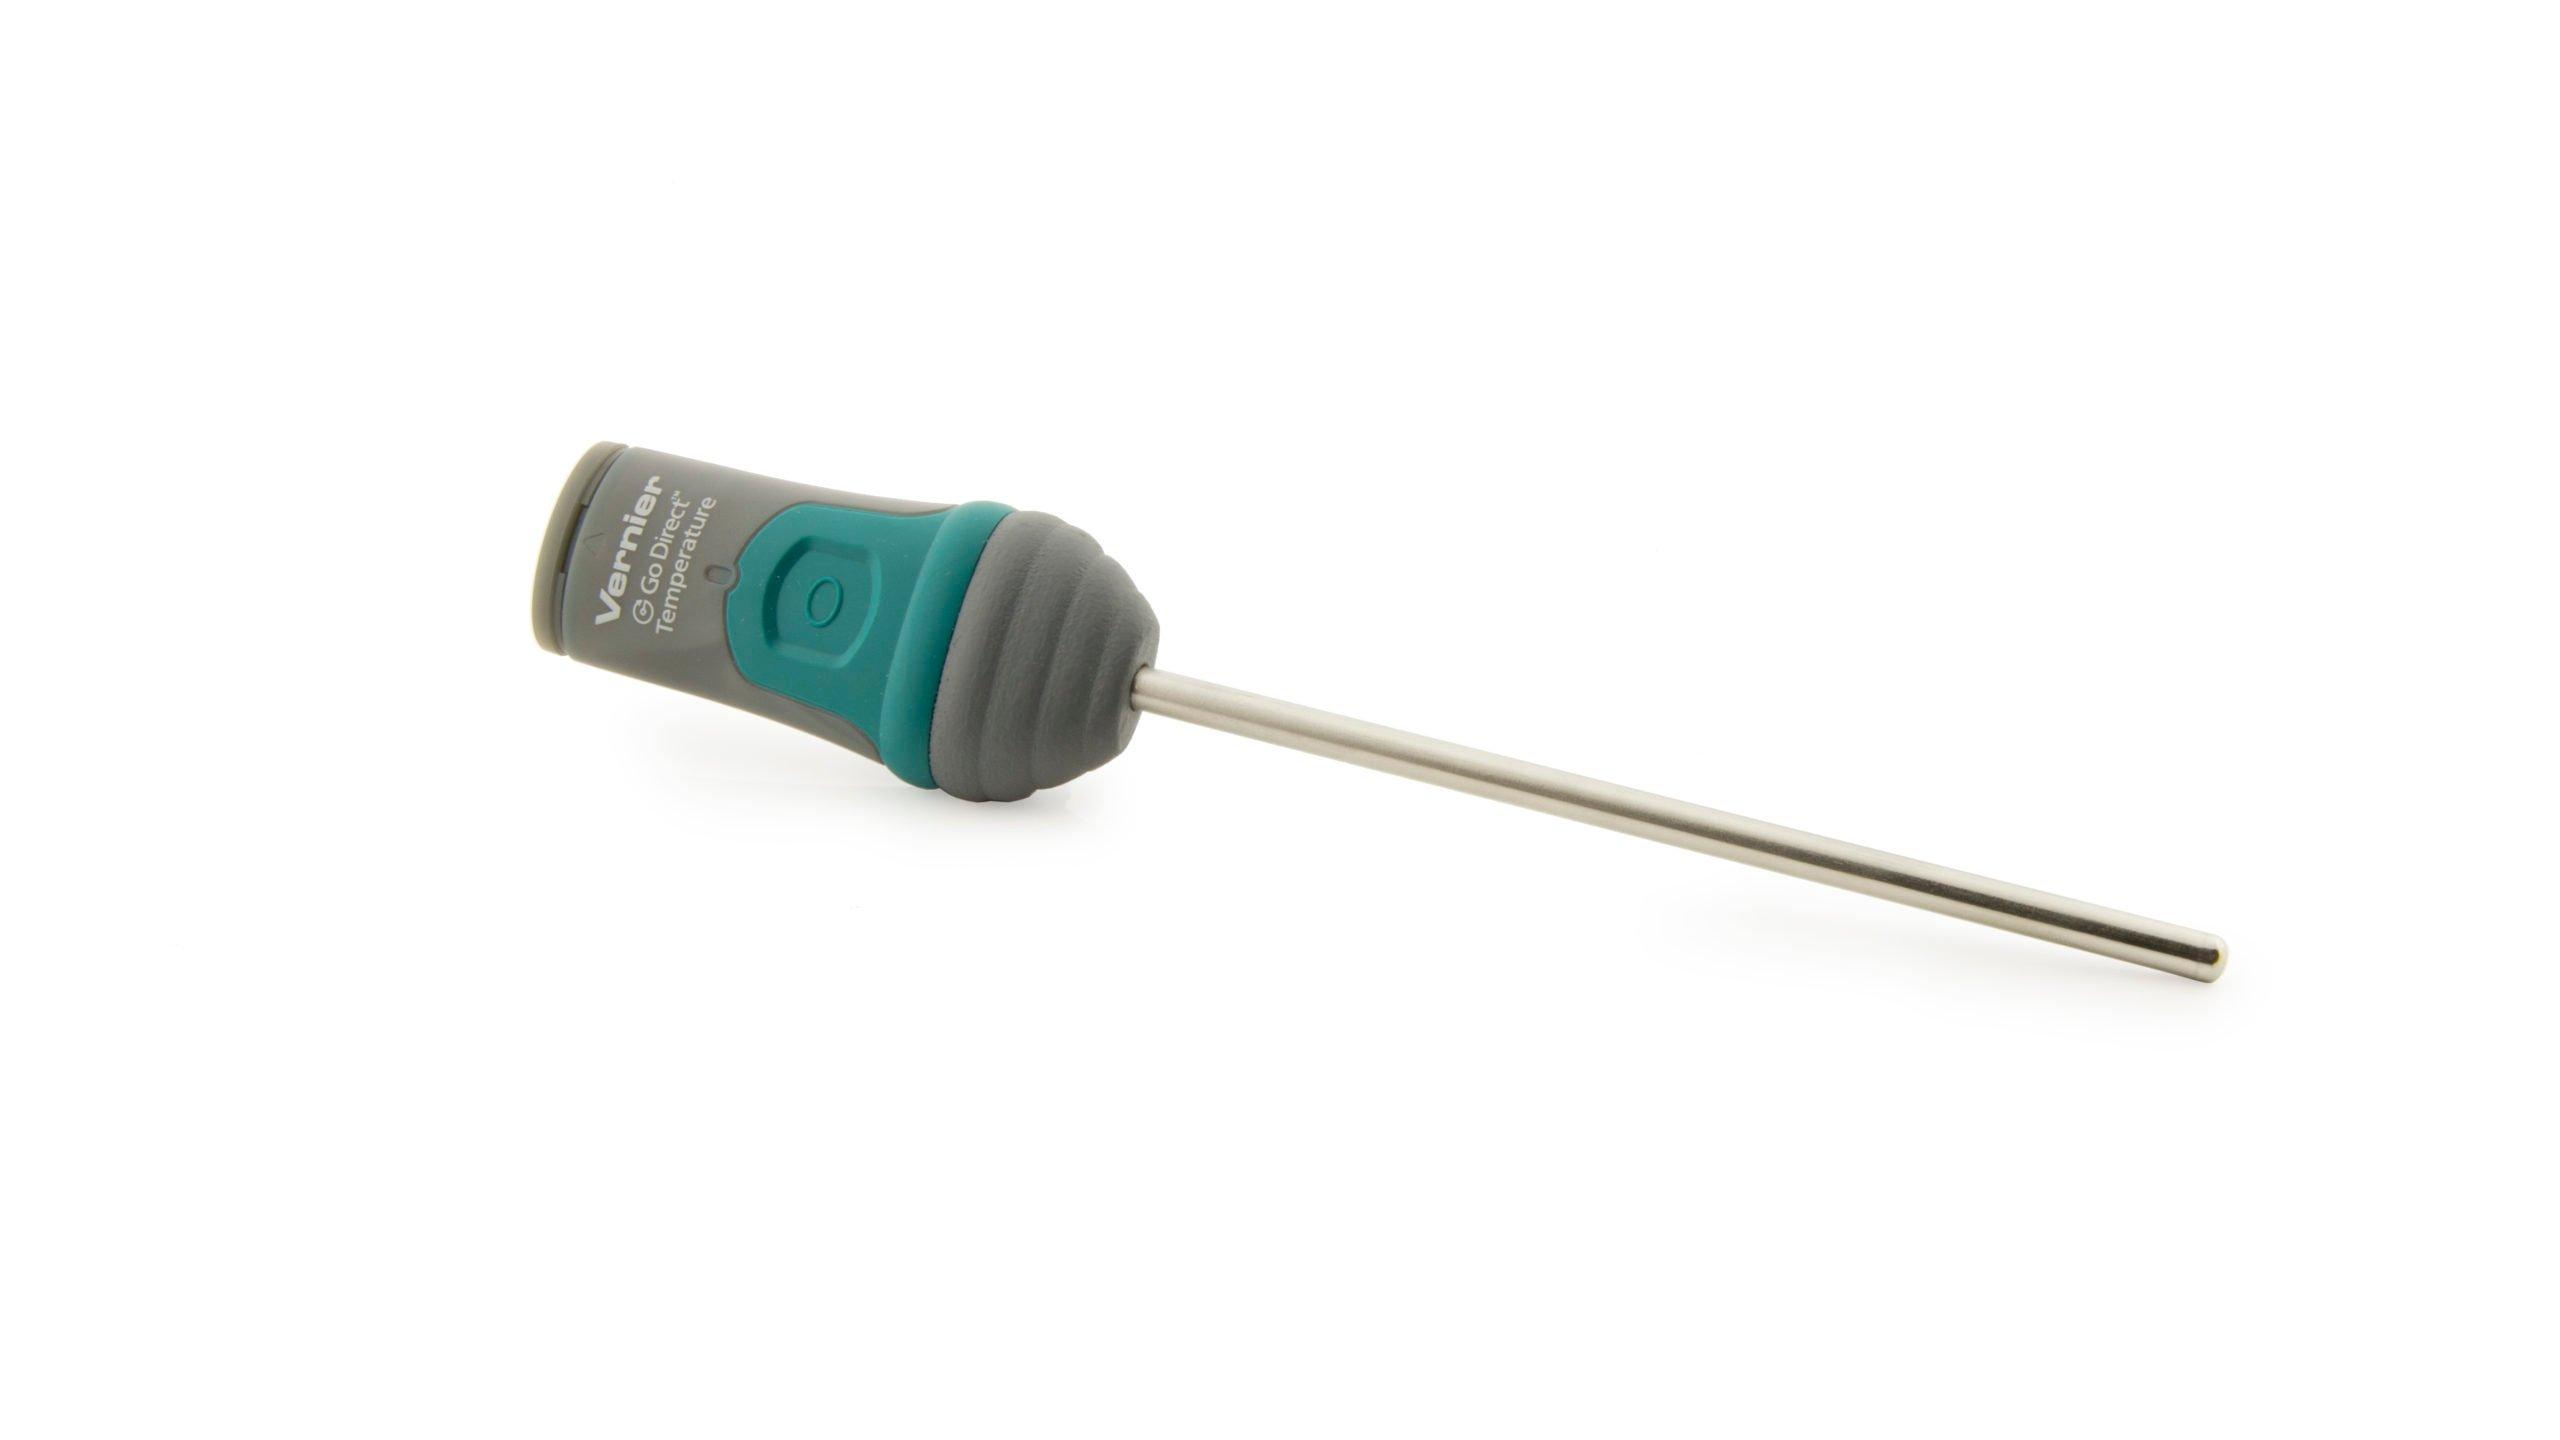
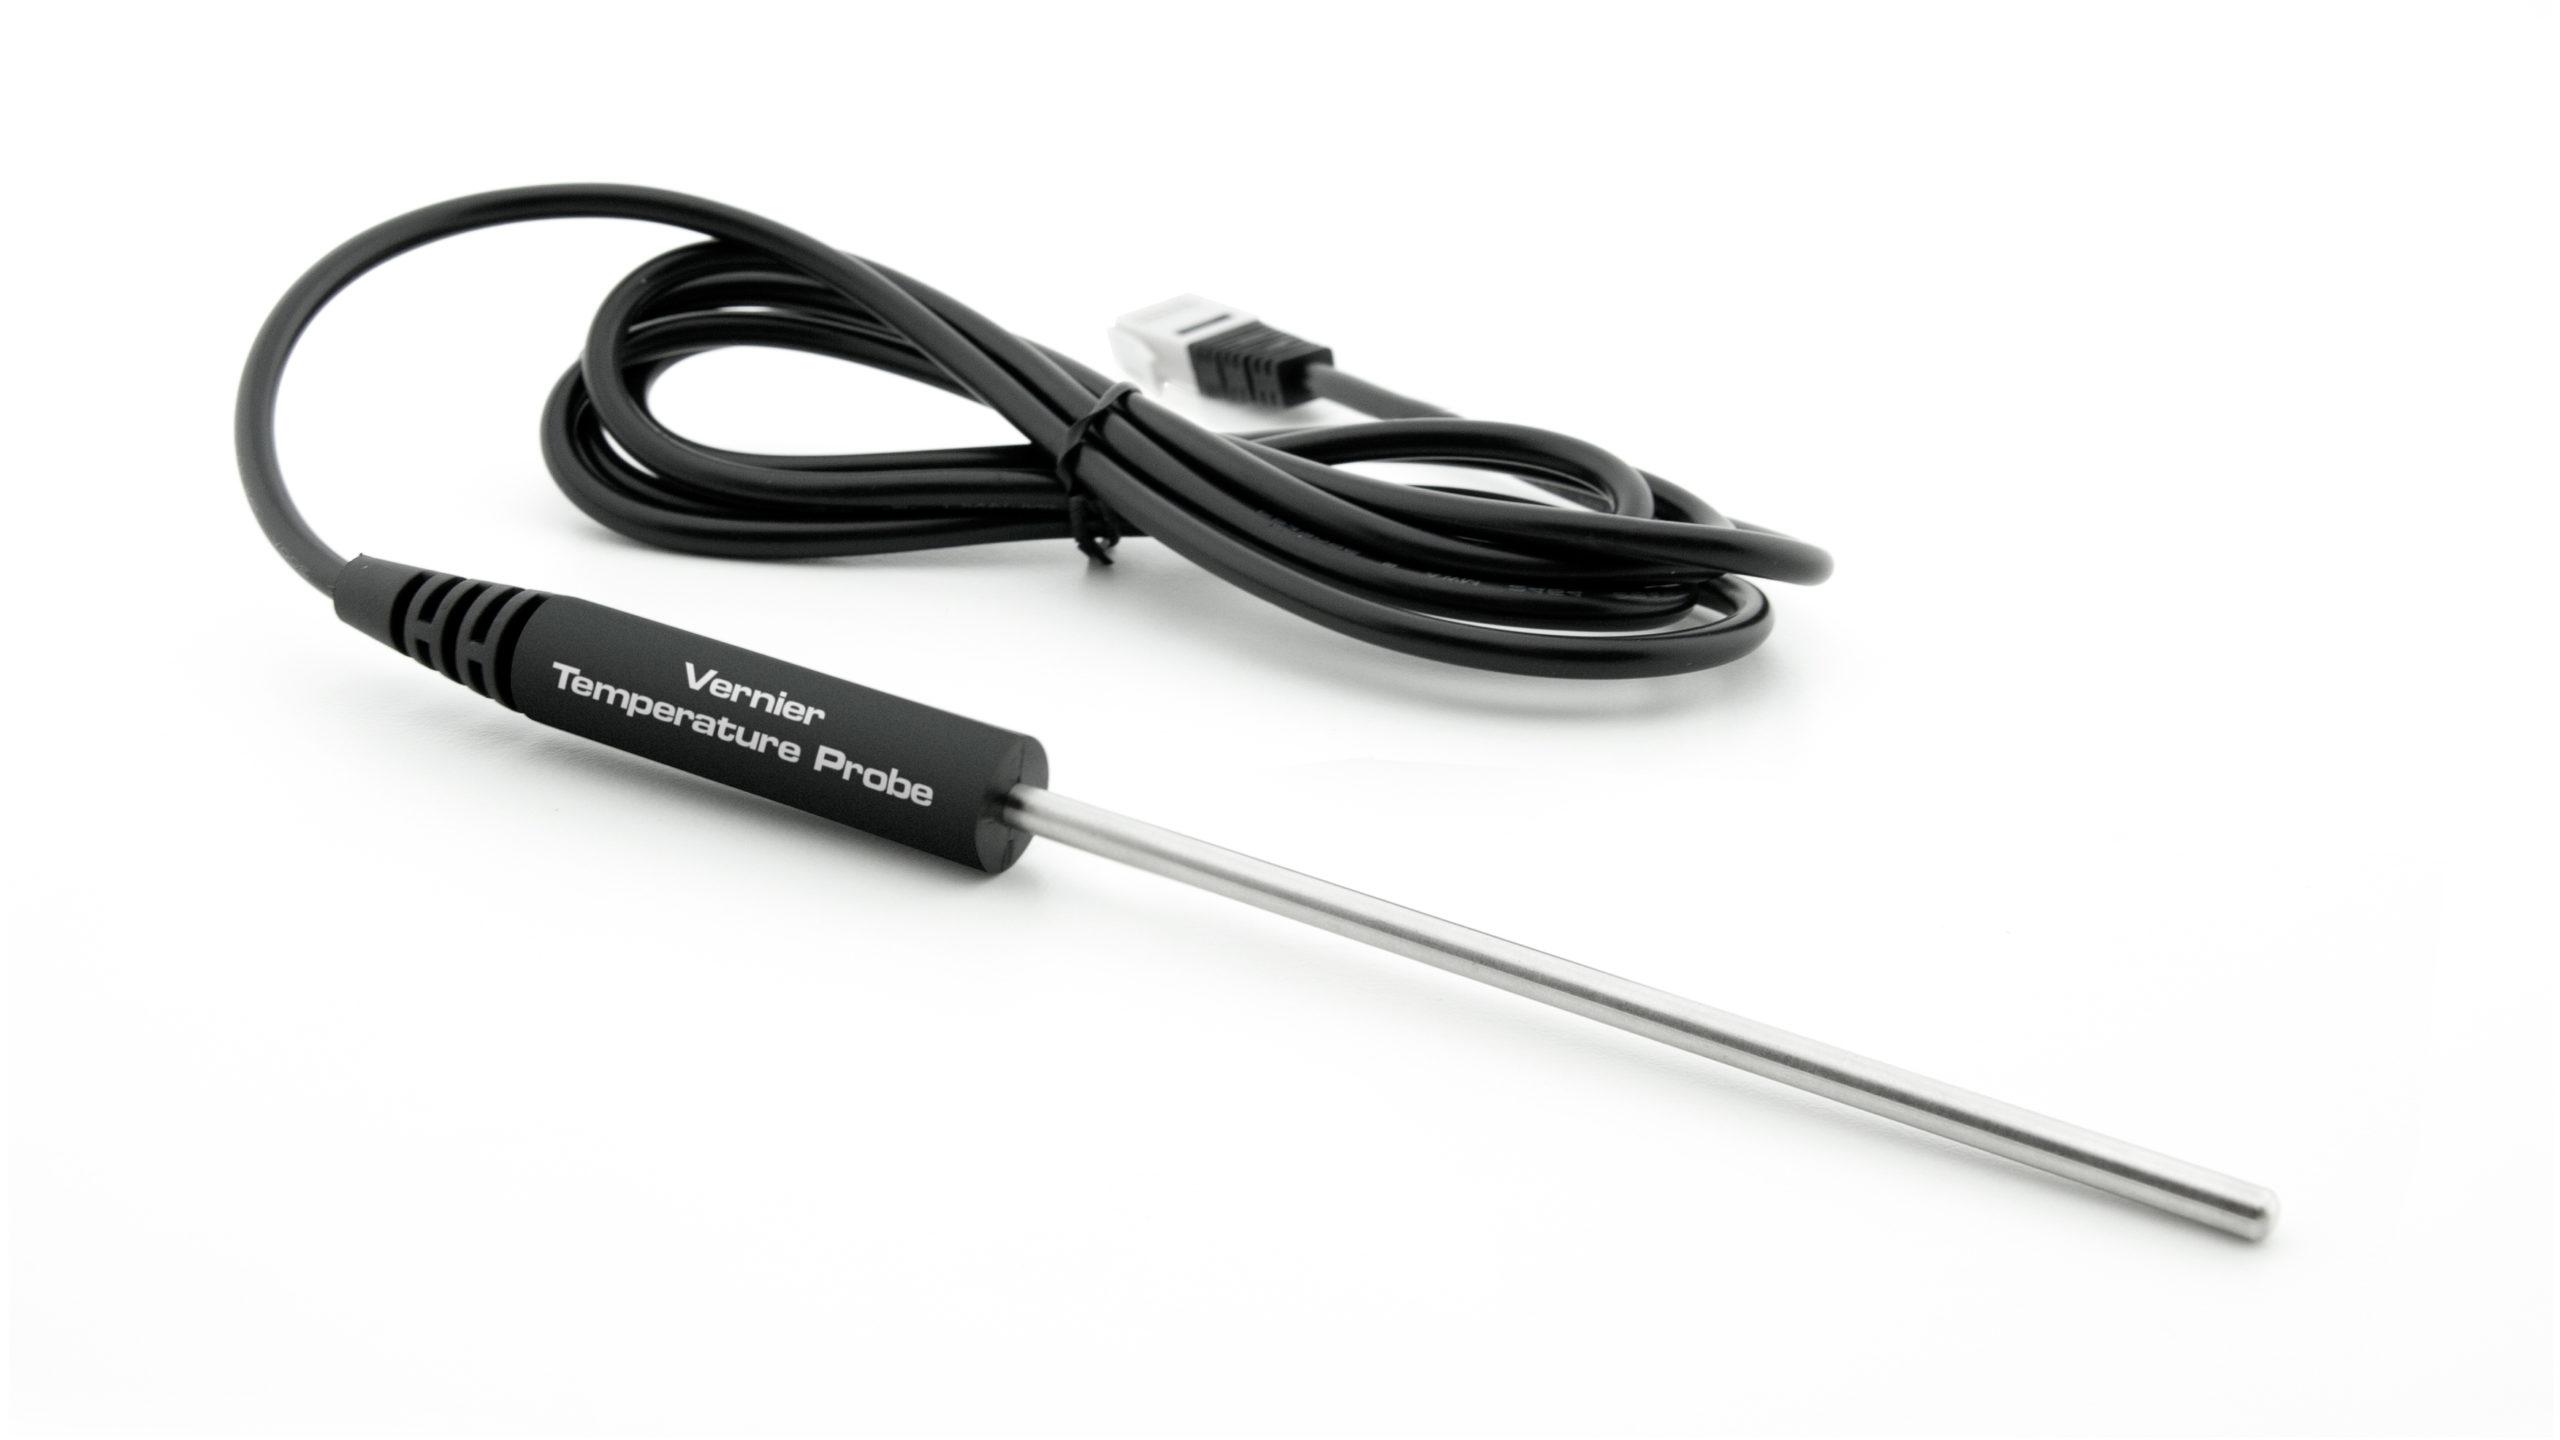
In this experiment, you will study the effect of changing temperature on the amount of solute that will dissolve in a given amount of water. Water solubility is an important physical property in chemistry, and is often expressed as the mass of solute that dissolves in 100 g of water at a certain temperature. In this experiment, you will completely dissolve different quantities of potassium nitrate, KNO3, in the same volume of water at a high temperature. As each solution cools, you will monitor temperature using a computer-interfaced Temperature Probe and observe the precise instant that solid crystals start to form. At this moment, the solution is saturated and contains the maximum amount of solute at that temperature. Thus each data pair consists of a solubility value (g of solute per 100 g H2O) and a corresponding temperature. A graph of the temperature-solubility data, known as a solubility curve, will be plotted using the computer.
Objectives
In this experiment, you will
- Study the effect of changing temperature on the amount of solute that will dissolve in a given amount of water.
- Plot a solubility curve.
Sensors and Equipment
This experiment features the following sensors and equipment. Additional equipment may be required.
Option 1
Correlations
Teaching to an educational standard? This experiment supports the standards below.
- International Baccalaureate (IB) 2025/Chemistry
- Structure 1.1.1—Elements are the primary constituents of matter, which cannot be chemically broken down into simpler substances.
Ready to Experiment?
Ask an Expert
Get answers to your questions about how to teach this experiment with our support team.
- Call toll-free: 888-837-6437
- Chat with Us
- Email support@vernier.com
Purchase the Lab Book
This experiment is #12 of Chemistry with Vernier. The experiment in the book includes student instructions as well as instructor information for set up, helpful hints, and sample graphs and data.
