Introduction to Data Collection
Experiment #1 from Exploring Physical Science
- Education Level
- Middle School
Introduction
Data collection is a very important part of science. Meteorologists collect weather data over time to keep a historical record and to help make forecasts. Oceanographers collect data on the salinity (saltiness) of seawater to study changing trends in our Earth’s oceans. While data have been collected by hand for thousands of years, the technology to collect data electronically has been around for fewer than 80 years. Only in the last 40 years has this technology been available in classrooms.
In this experiment, you will learn about two of the most common modes of data collection: time-based mode and events with entry mode. You will learn about the modes so you can understand when to use each one. When you do experiments in the future, you will be able to decide which mode is best for what you want to investigate.
Objectives
- Become familiar with Graphical Analysis 4.
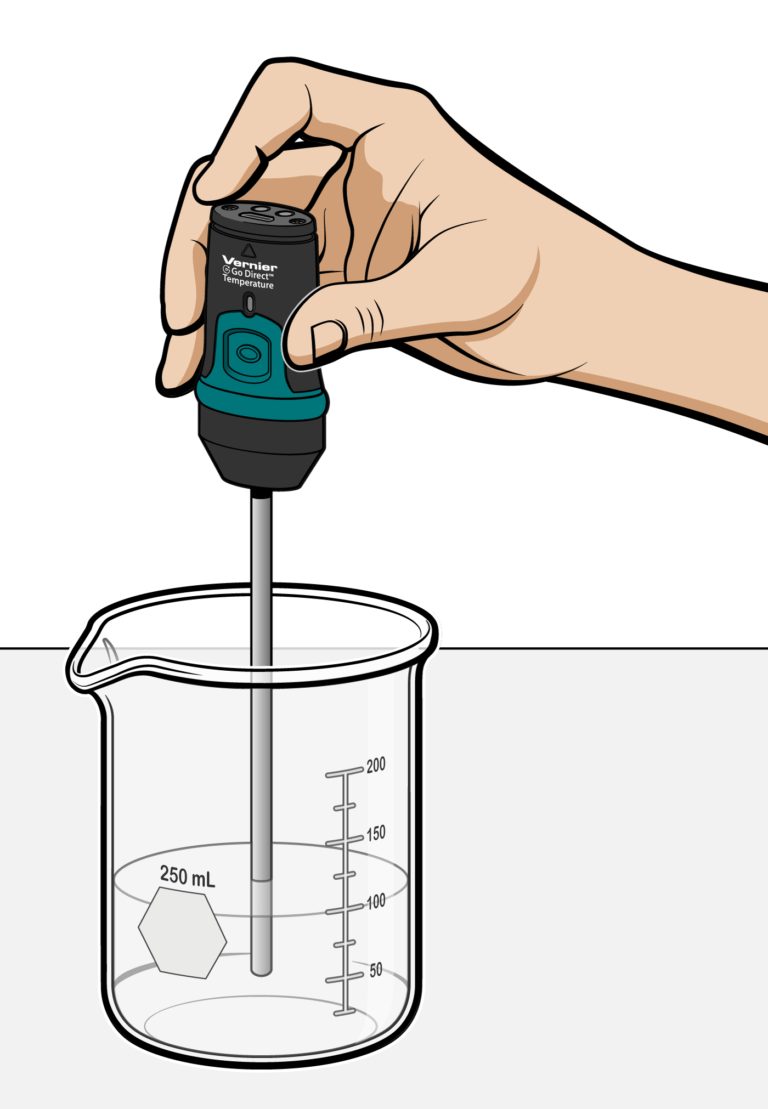
- Use Graphical Analysis 4 and a Temperature Probe to make measurements.
- Analyze data in a graph and a table.
- Determine the response time of a Temperature Probe.
- Learn about different data collection modes and when to use each.
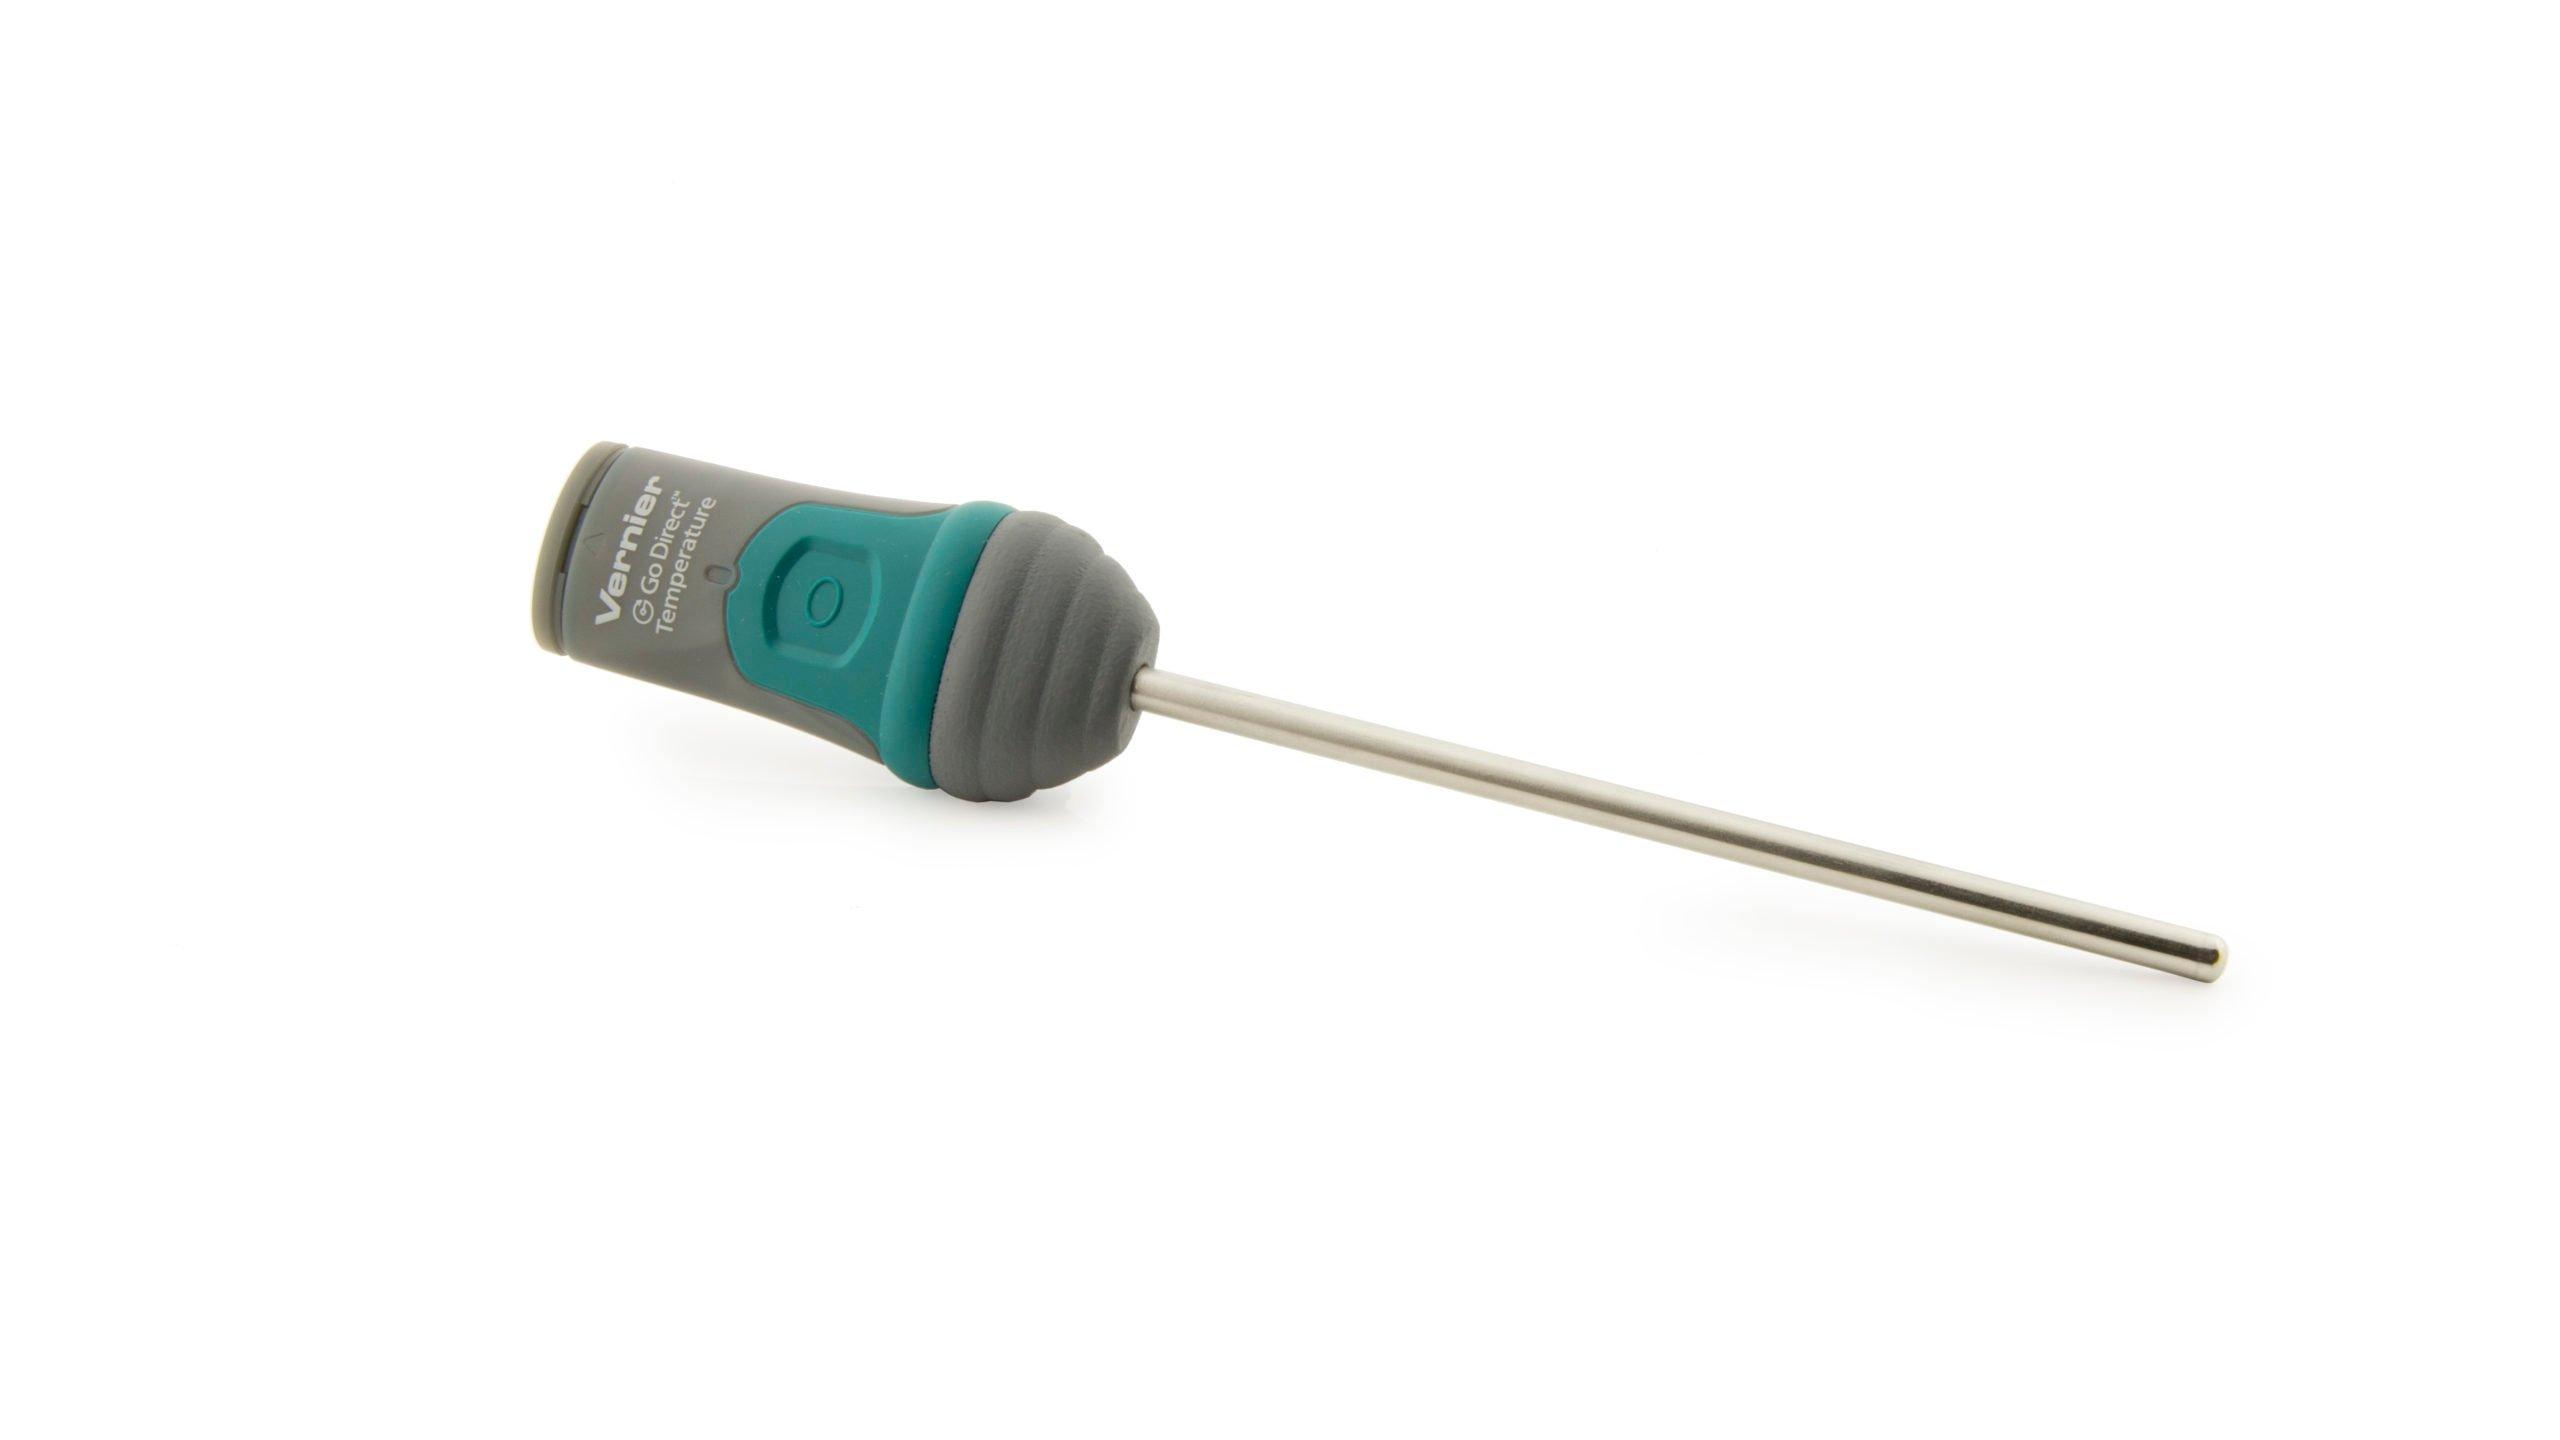
Sensors and Equipment
This experiment features the following sensors and equipment. Additional equipment may be required.
Ready to Experiment?
Ask an Expert
Get answers to your questions about how to teach this experiment with our support team.
- Call toll-free: 888-837-6437
- Chat with Us
- Email support@vernier.com
Purchase the Lab Book
This experiment is #1 of Exploring Physical Science. The experiment in the book includes student instructions as well as instructor information for set up, helpful hints, and sample graphs and data.