Introduction
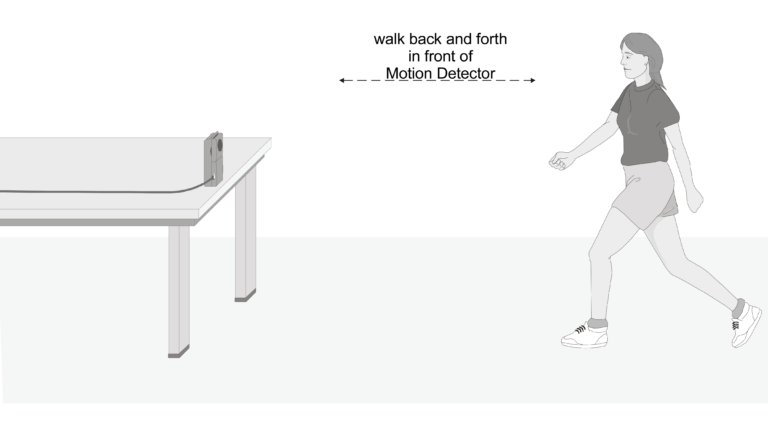
Graphs made using a computer-interfaced Motion Detector can be use to study motion. A Motion Detector measures the distance to the nearest object in front of it. The computer reports the measurement as position along a line, and can calculate velocity and acceleration values. To determine distances, a Motion Detector emits and receives pulses of ultrasound. In this experiment, you will use a computer-interfaced Motion Detector to produce graphs of your own motion.
Objectives
In this experiment, you will
- Use a Motion Detector to measure position, velocity, and acceleration.
- Produce graphs of your motion.
- Analyze and interpret motion graphs.
Sensors and Equipment
This experiment features the following sensors and equipment. Additional equipment may be required.

Ready to Experiment?
Ask an Expert
Get answers to your questions about how to teach this experiment with our support team.
- Call toll-free: 888-837-6437
- Chat with Us
- Email support@vernier.com
Purchase the Lab Book
This experiment is #35 of Physical Science with Vernier. The experiment in the book includes student instructions as well as instructor information for set up, helpful hints, and sample graphs and data.
