And Now, the Weather – Describing Data with Statistics
Experiment #26 from Real-World Math with Vernier
- Education Level
- High School
Introduction
Meteorologists use mathematics to interpret weather patterns and make predictions. Part of the job involves collecting and analyzing temperature data. Once the meteorologists have collected a large number of measurements, they have a problem: How do they make sense of a long list of numbers? What is needed is a way of describing the set of data with just a few numbers. We call those numbers descriptive statistics. One important need is to be able to represent the set of measurements with a single number. There are several ways to do this:
- The mean temperature is what we usually think of when we hear the word “average.” It is the sum of the temperature values in the data set divided by the number of elements in the set.
- The median temperature represents the center data point of the set after all the elements have been placed in order from lowest to highest.
Almost any weather report includes a summary of the day’s high temperature, called the maximum value, and the day’s low temperature, called the minimum value. The difference between these two statistics, called the range, shows the variability or spread of the data.
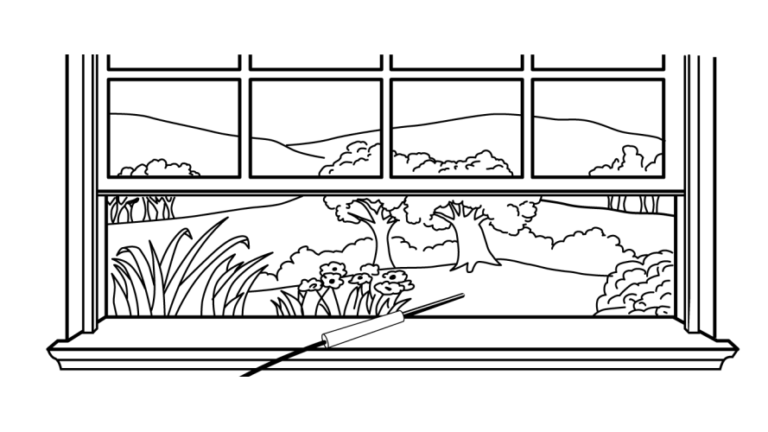
In this activity you will collect outdoor temperature readings over a day-long period using a temperature probe. After this data has been transferred to the calculator, you will use its statistical analysis tools to create your own temperature report.
Objectives
- Record temperature data over a day-long period.
- Describe the temperature data using statistical concepts.
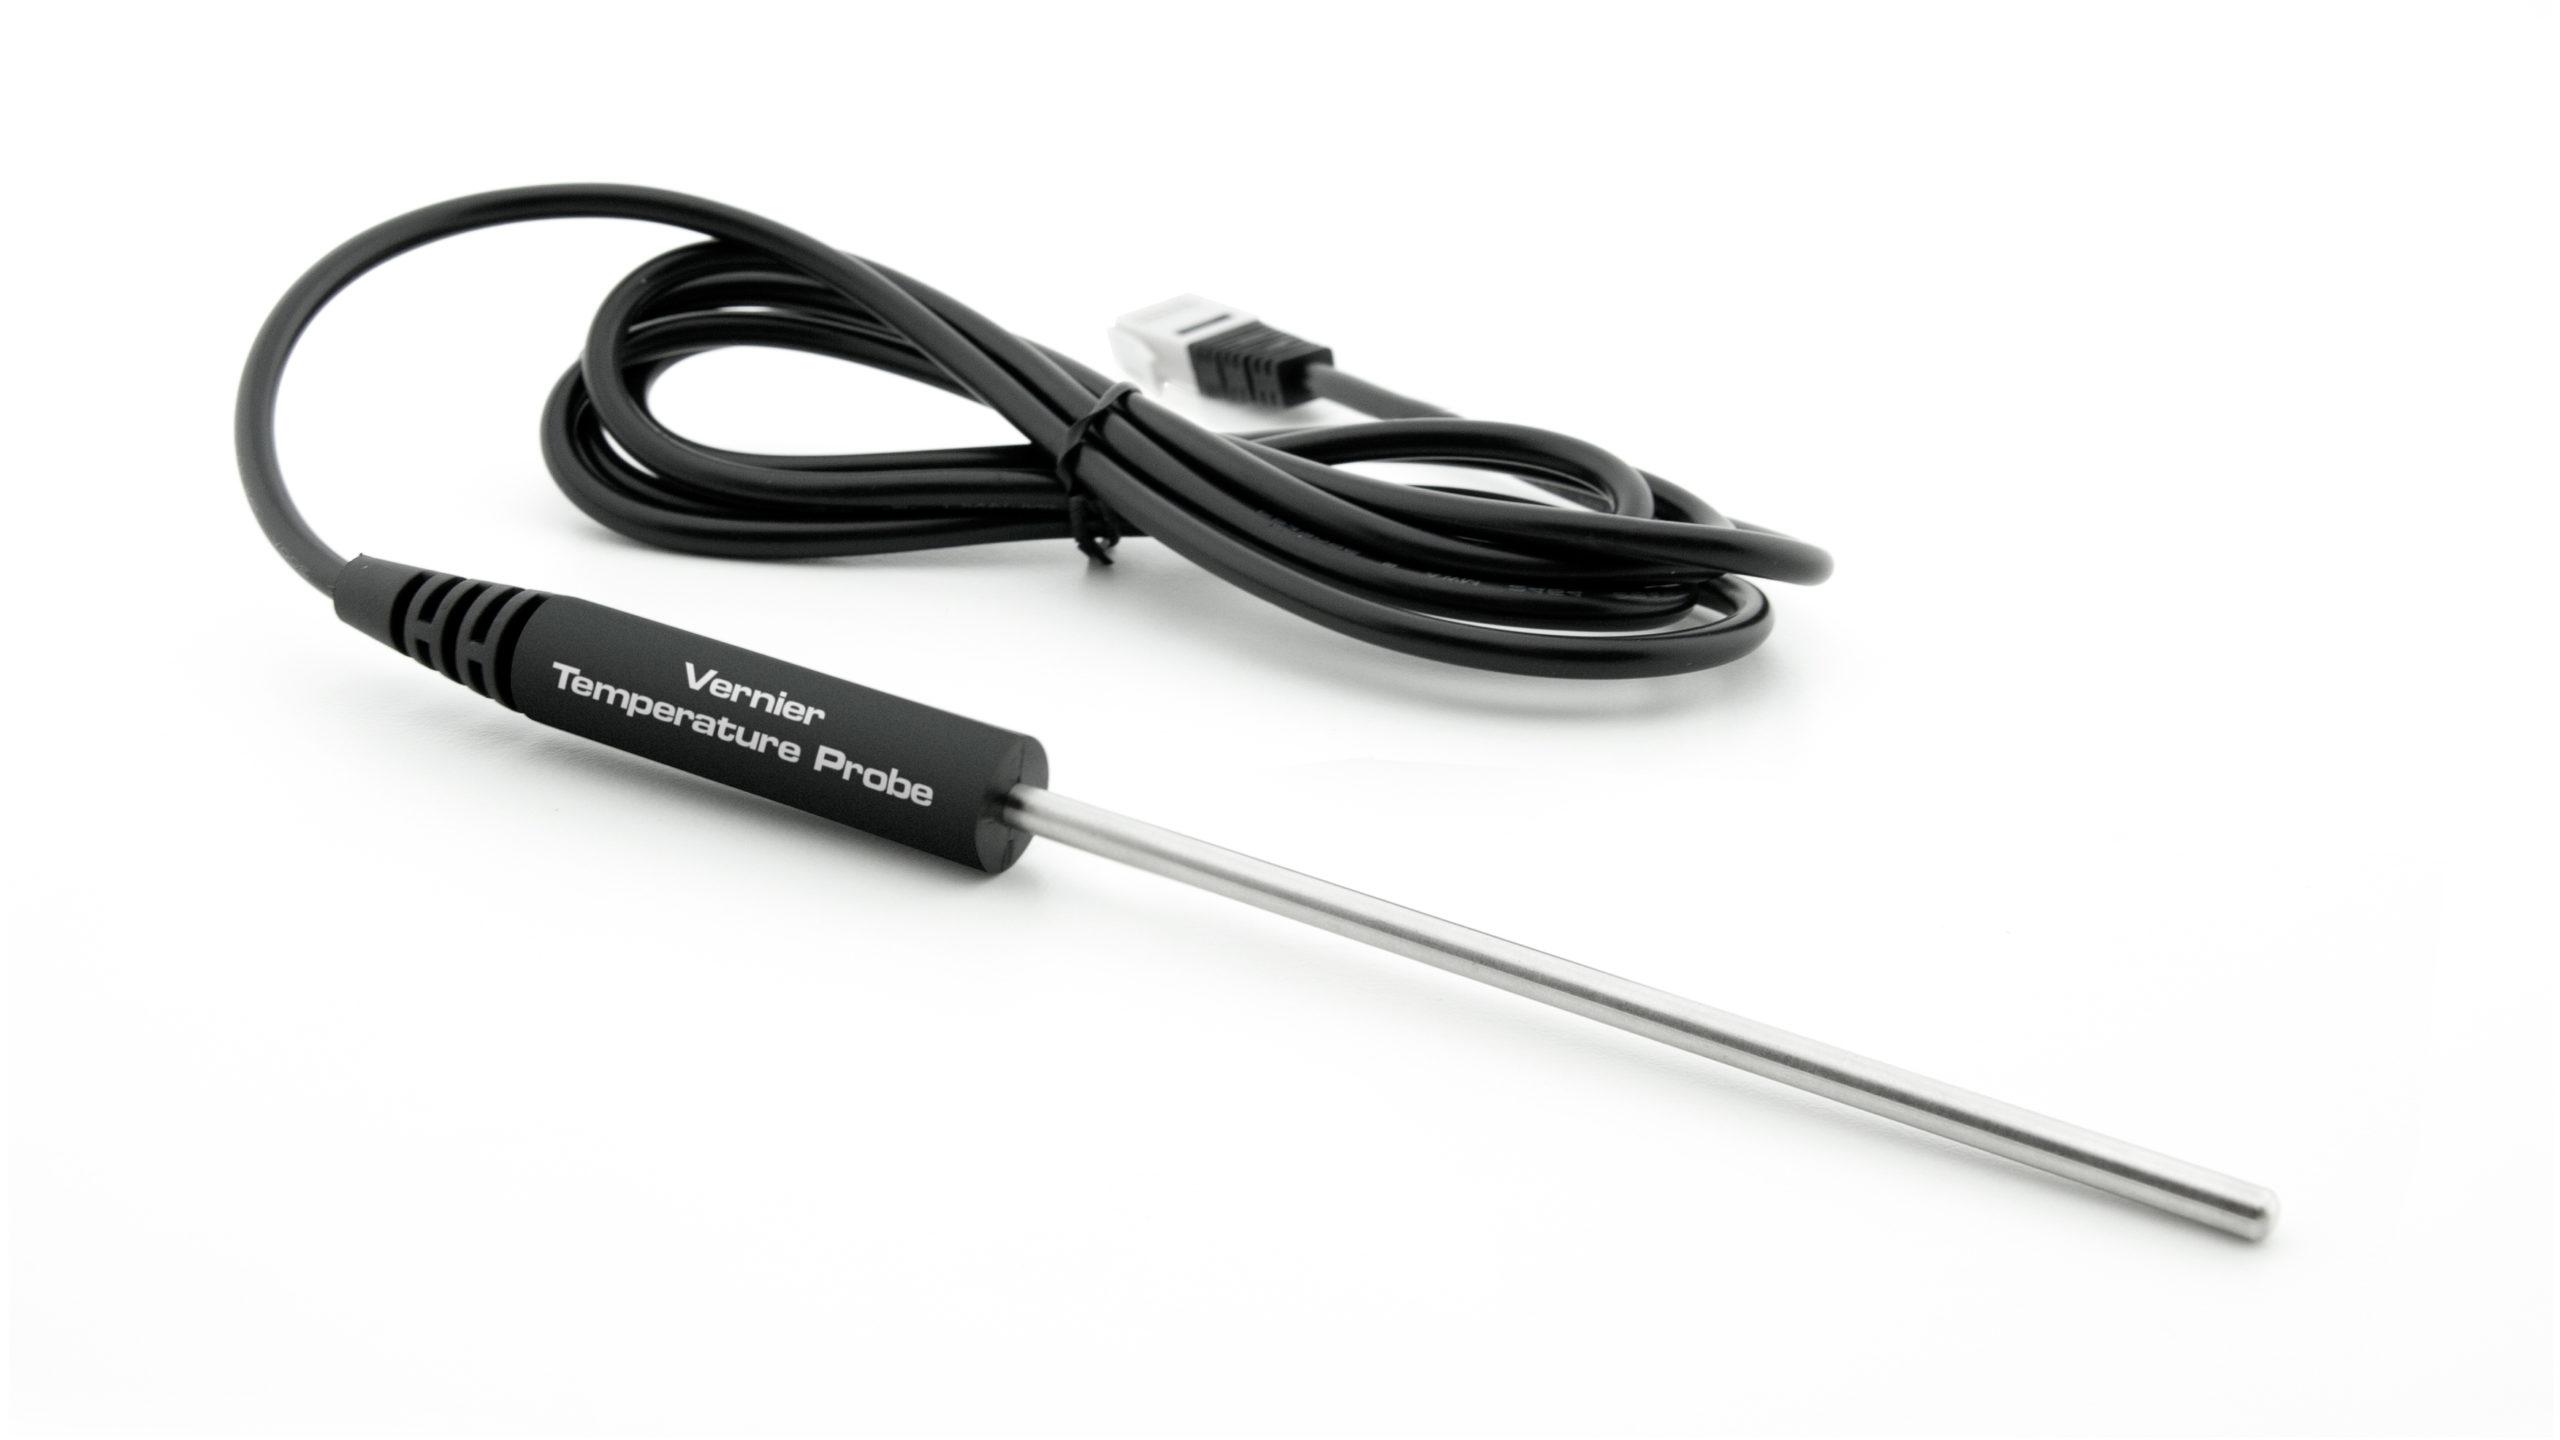
Sensors and Equipment
This experiment features the following sensors and equipment. Additional equipment may be required.
Ready to Experiment?
Ask an Expert
Get answers to your questions about how to teach this experiment with our support team.
- Call toll-free: 888-837-6437
- Chat with Us
- Email support@vernier.com
Purchase the Lab Book
This experiment is #26 of Real-World Math with Vernier. The experiment in the book includes student instructions as well as instructor information for set up, helpful hints, and sample graphs and data.