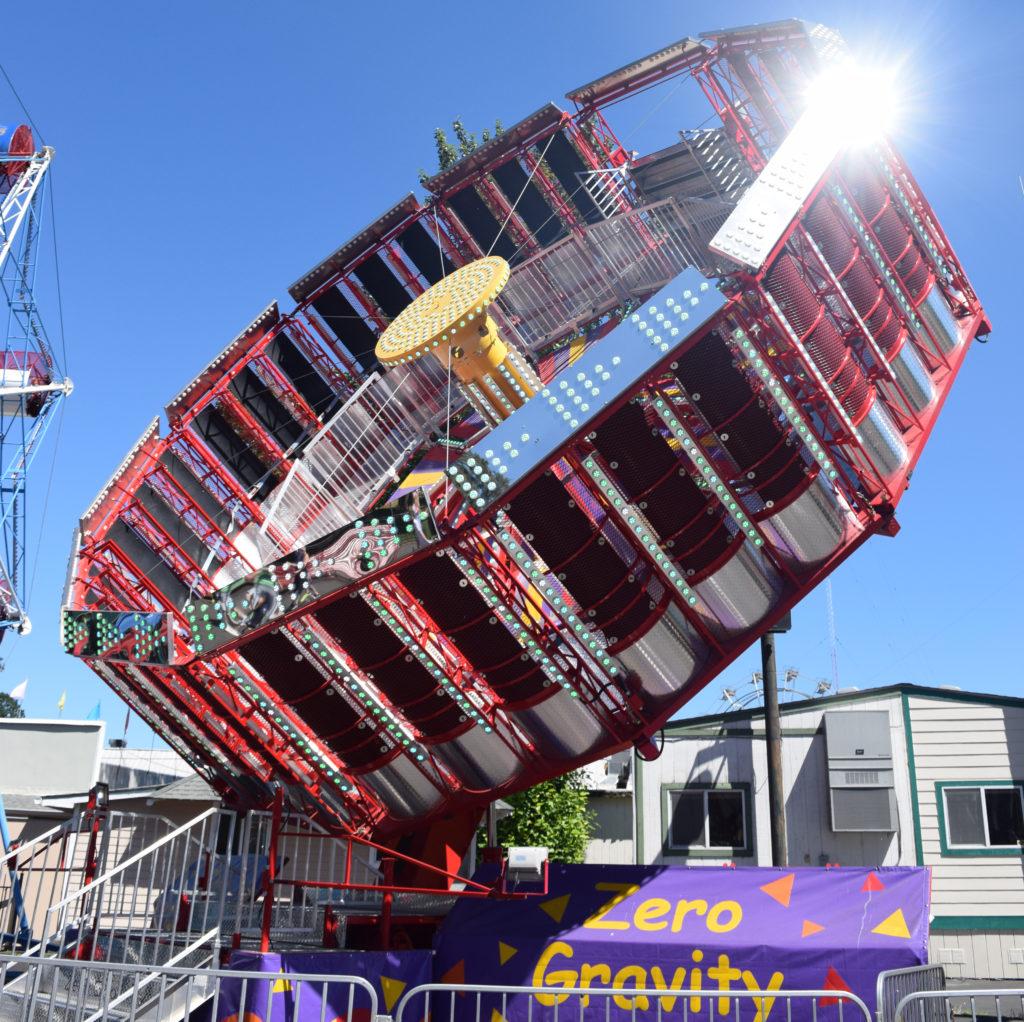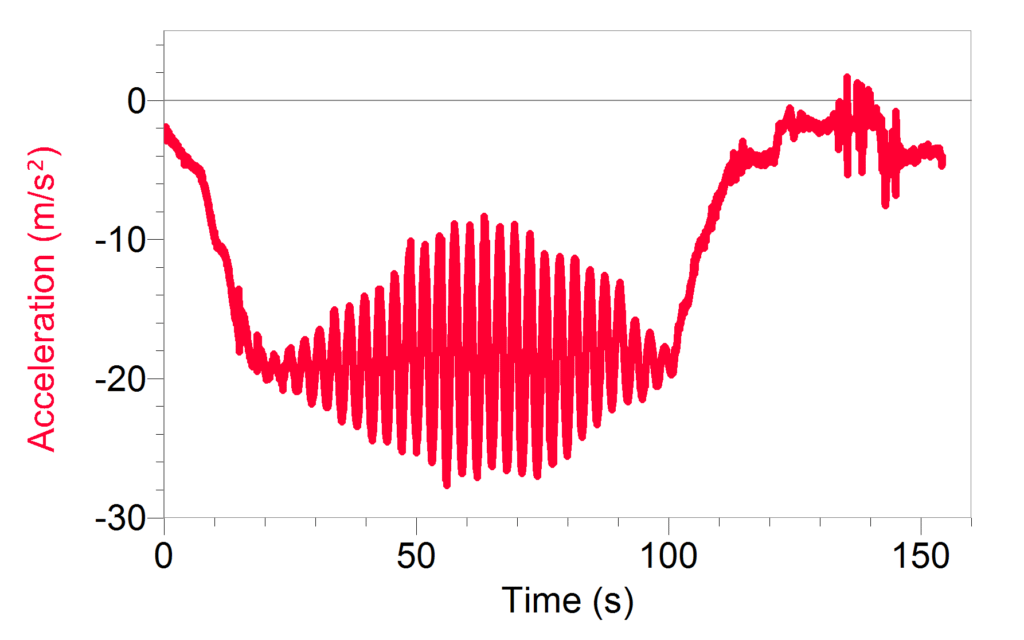
Chris Murray, of Tualatin High School in Tualatin, Oregon, recently sent us some great data taken with LabQuest and a Low-g Accelerometer on an amusement park ride, called Zero Gravity (also known as Round Up). As the ride began, a student held the accelerometer at chest level, pointed horizontally. When the motion started, two things happened: the axis of rotation tipped down and the angular speed increased.
There are so many more things you could investigate: How fast was the ride rotating at the maximum? How do you explain the shape of the graph? Why did they call the ride Zero Gravity?

