Titration Curves of Strong and Weak Acids and Bases
Experiment #23 from Chemistry with Vernier
- Education Level
- High School
- Subject
- Chemistry
Introduction
In this experiment you will react the following combinations of strong and weak acids and bases:
- Hydrochloric acid, HCl (strong acid), with sodium hydroxide, NaOH (strong base)
- Hydrochloric acid, HCl (strong acid), with ammonia, NH3 (weak base)
- Acetic acid, HC2H3O2 (weak acid), with sodium hydroxide, NaOH (strong base)
- Acetic acid, HC2H3O2 (weak acid), with ammonia, NH3 (weak base)
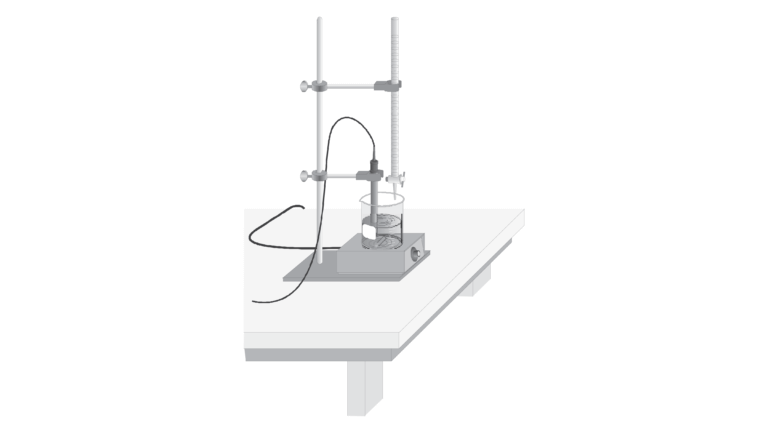
A pH Sensor will be placed in one of the acid solutions. A solution of one of the bases will slowly drip from a buret into the acid solution at a constant rate. As base is added to the acid, you should see a gradual change in pH until the solution gets close to the equivalence point. At the equivalence point, equal numbers of moles of acid and base have been added. Near the equivalence point, a rapid change in pH occurs. Beyond the equivalence point, where more base has been added than acid, you should again observe more gradual changes in pH. A titration curve is normally a plot of pH versus volume of titrant. In this experiment, however, we will monitor and plot pH versus time, and assume that time is proportional to volume of base. The volume being delivered by the buret per unit time should be nearly constant.
One objective of this lab is to observe differences in shapes of titration curves when various strengths of acids and bases are combined. You will also learn about the function and selection of appropriate acid-base indicators in this experiment. In order to do several other experiments in this lab manual, you need to be able to interpret the shape of a titration curve.
Objectives
In this experiment, you will
- Observe differences in shapes of titration curves when various strengths of acids and bases are combined.
- Learn about the function and selection of appropriate acid-base indicators.
- Learn how to interpret the shape of a titration curve.
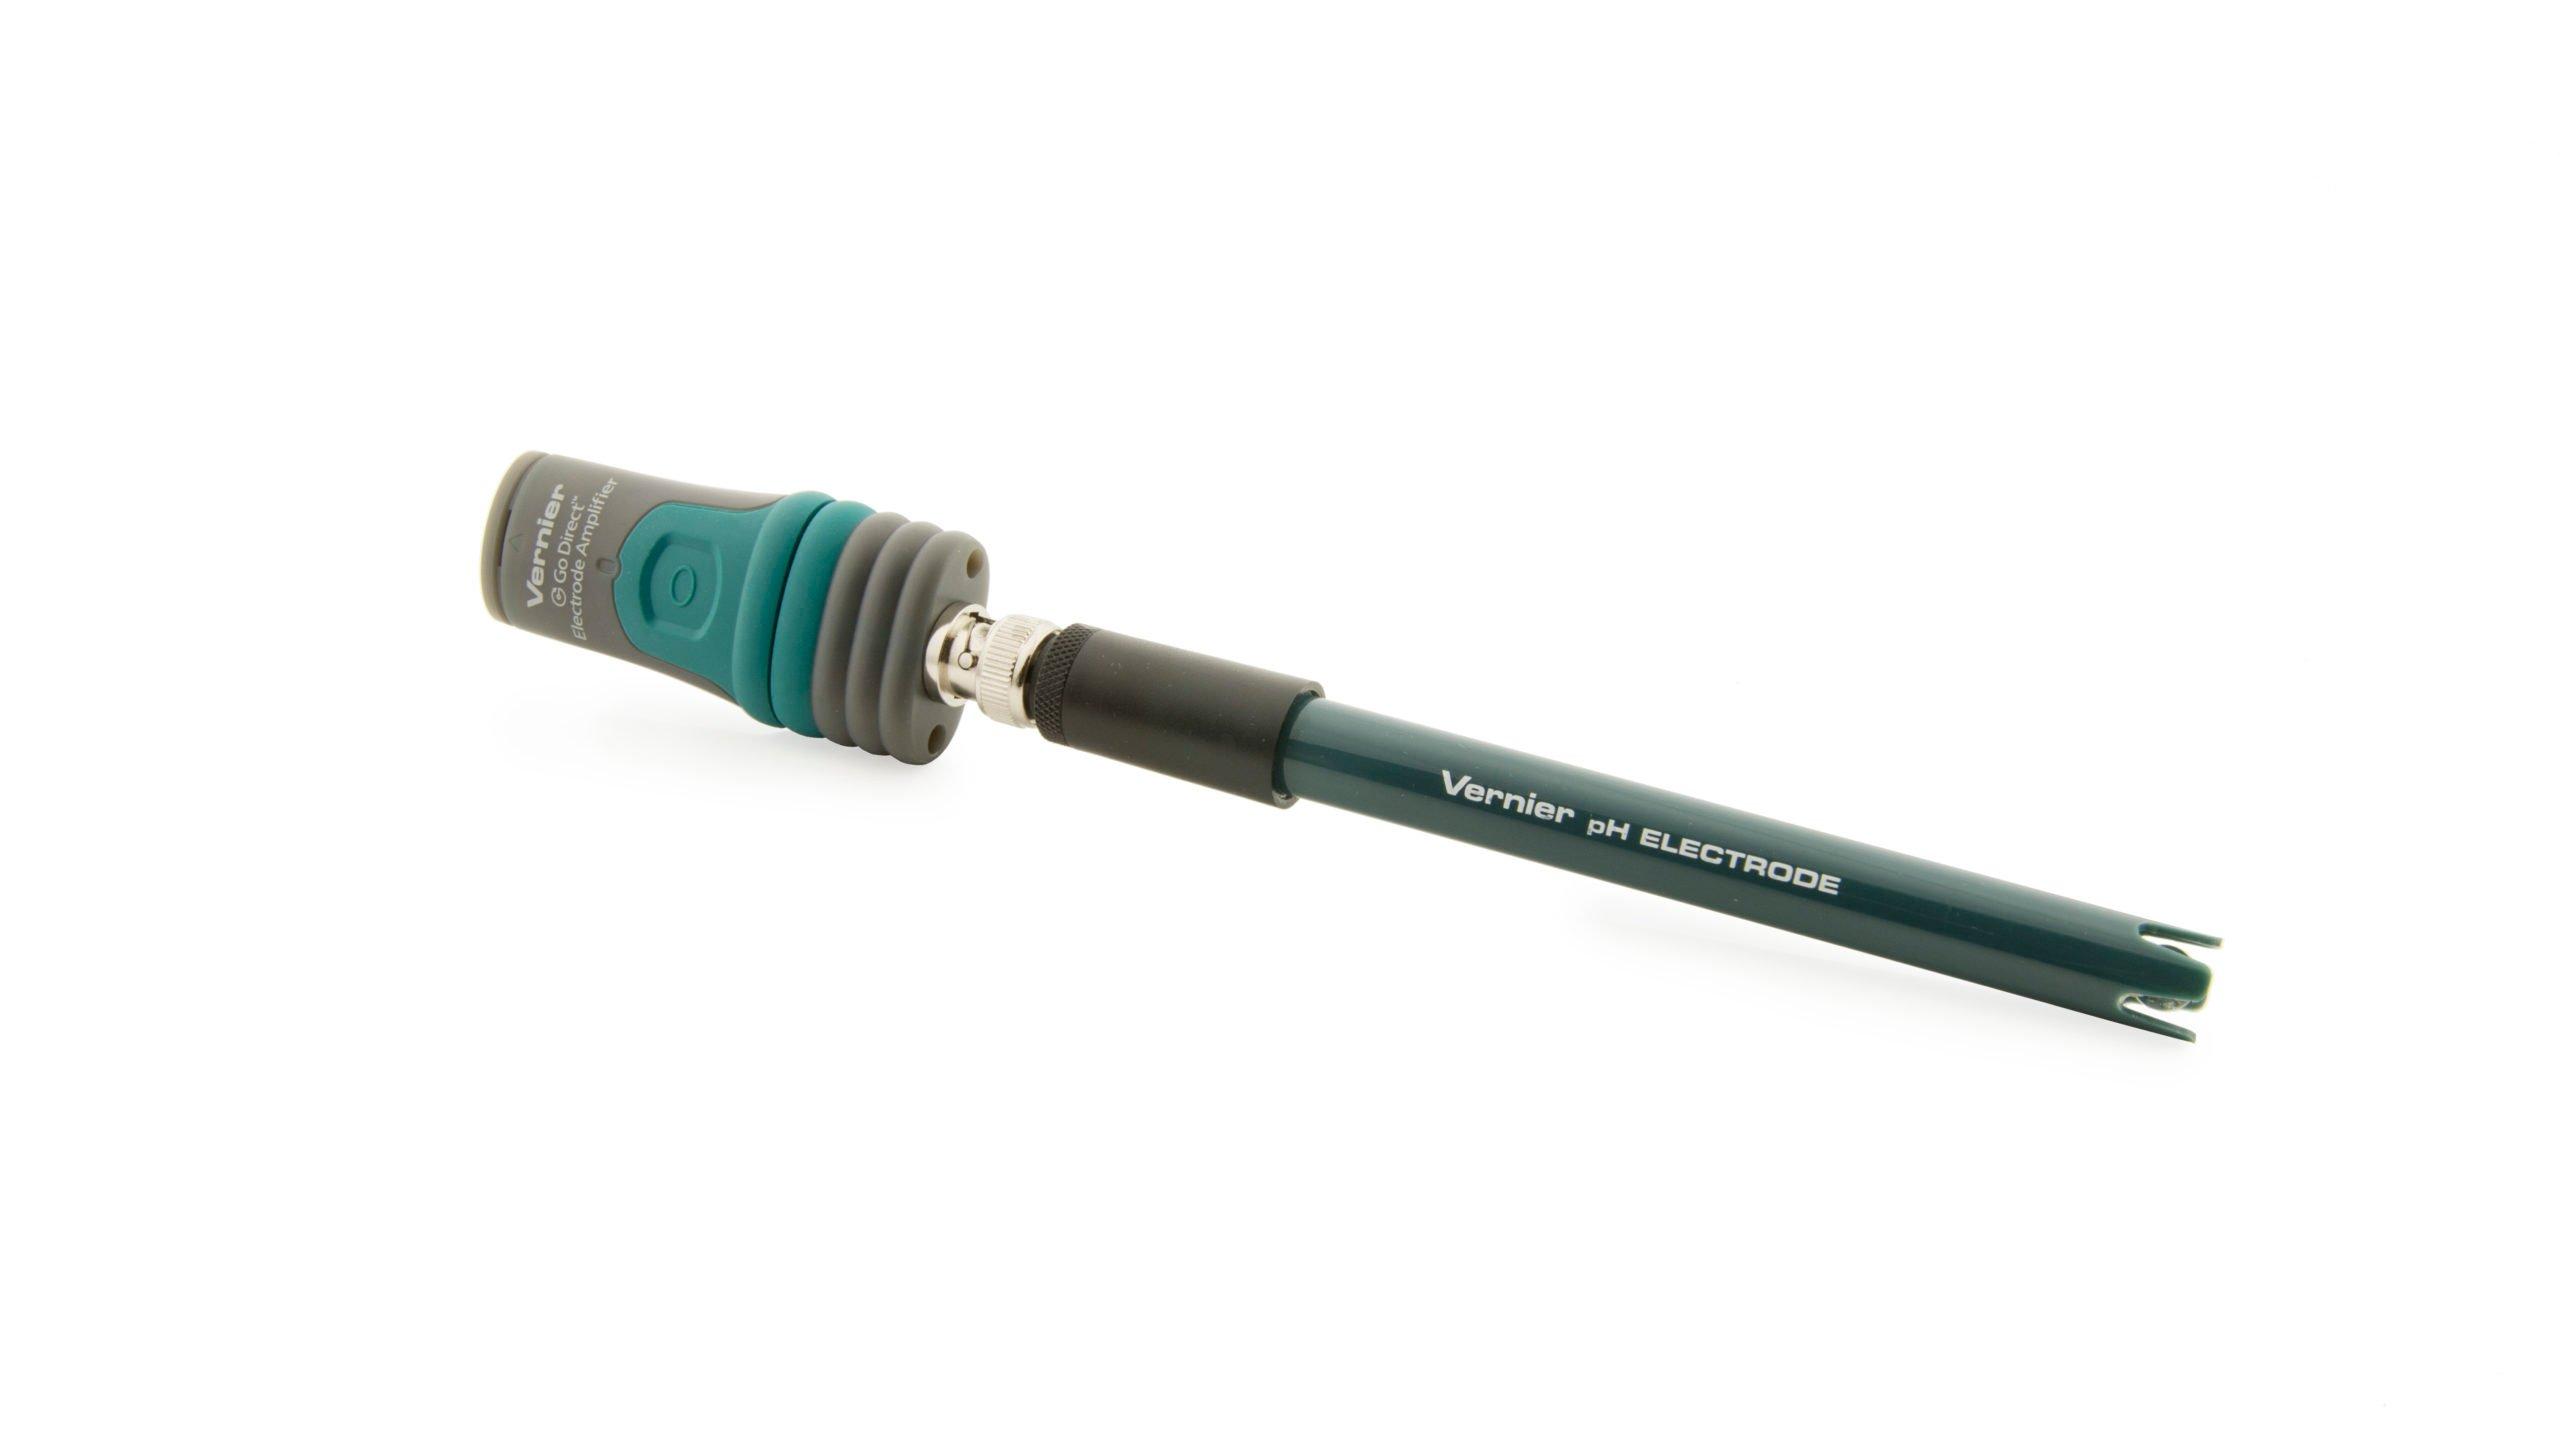
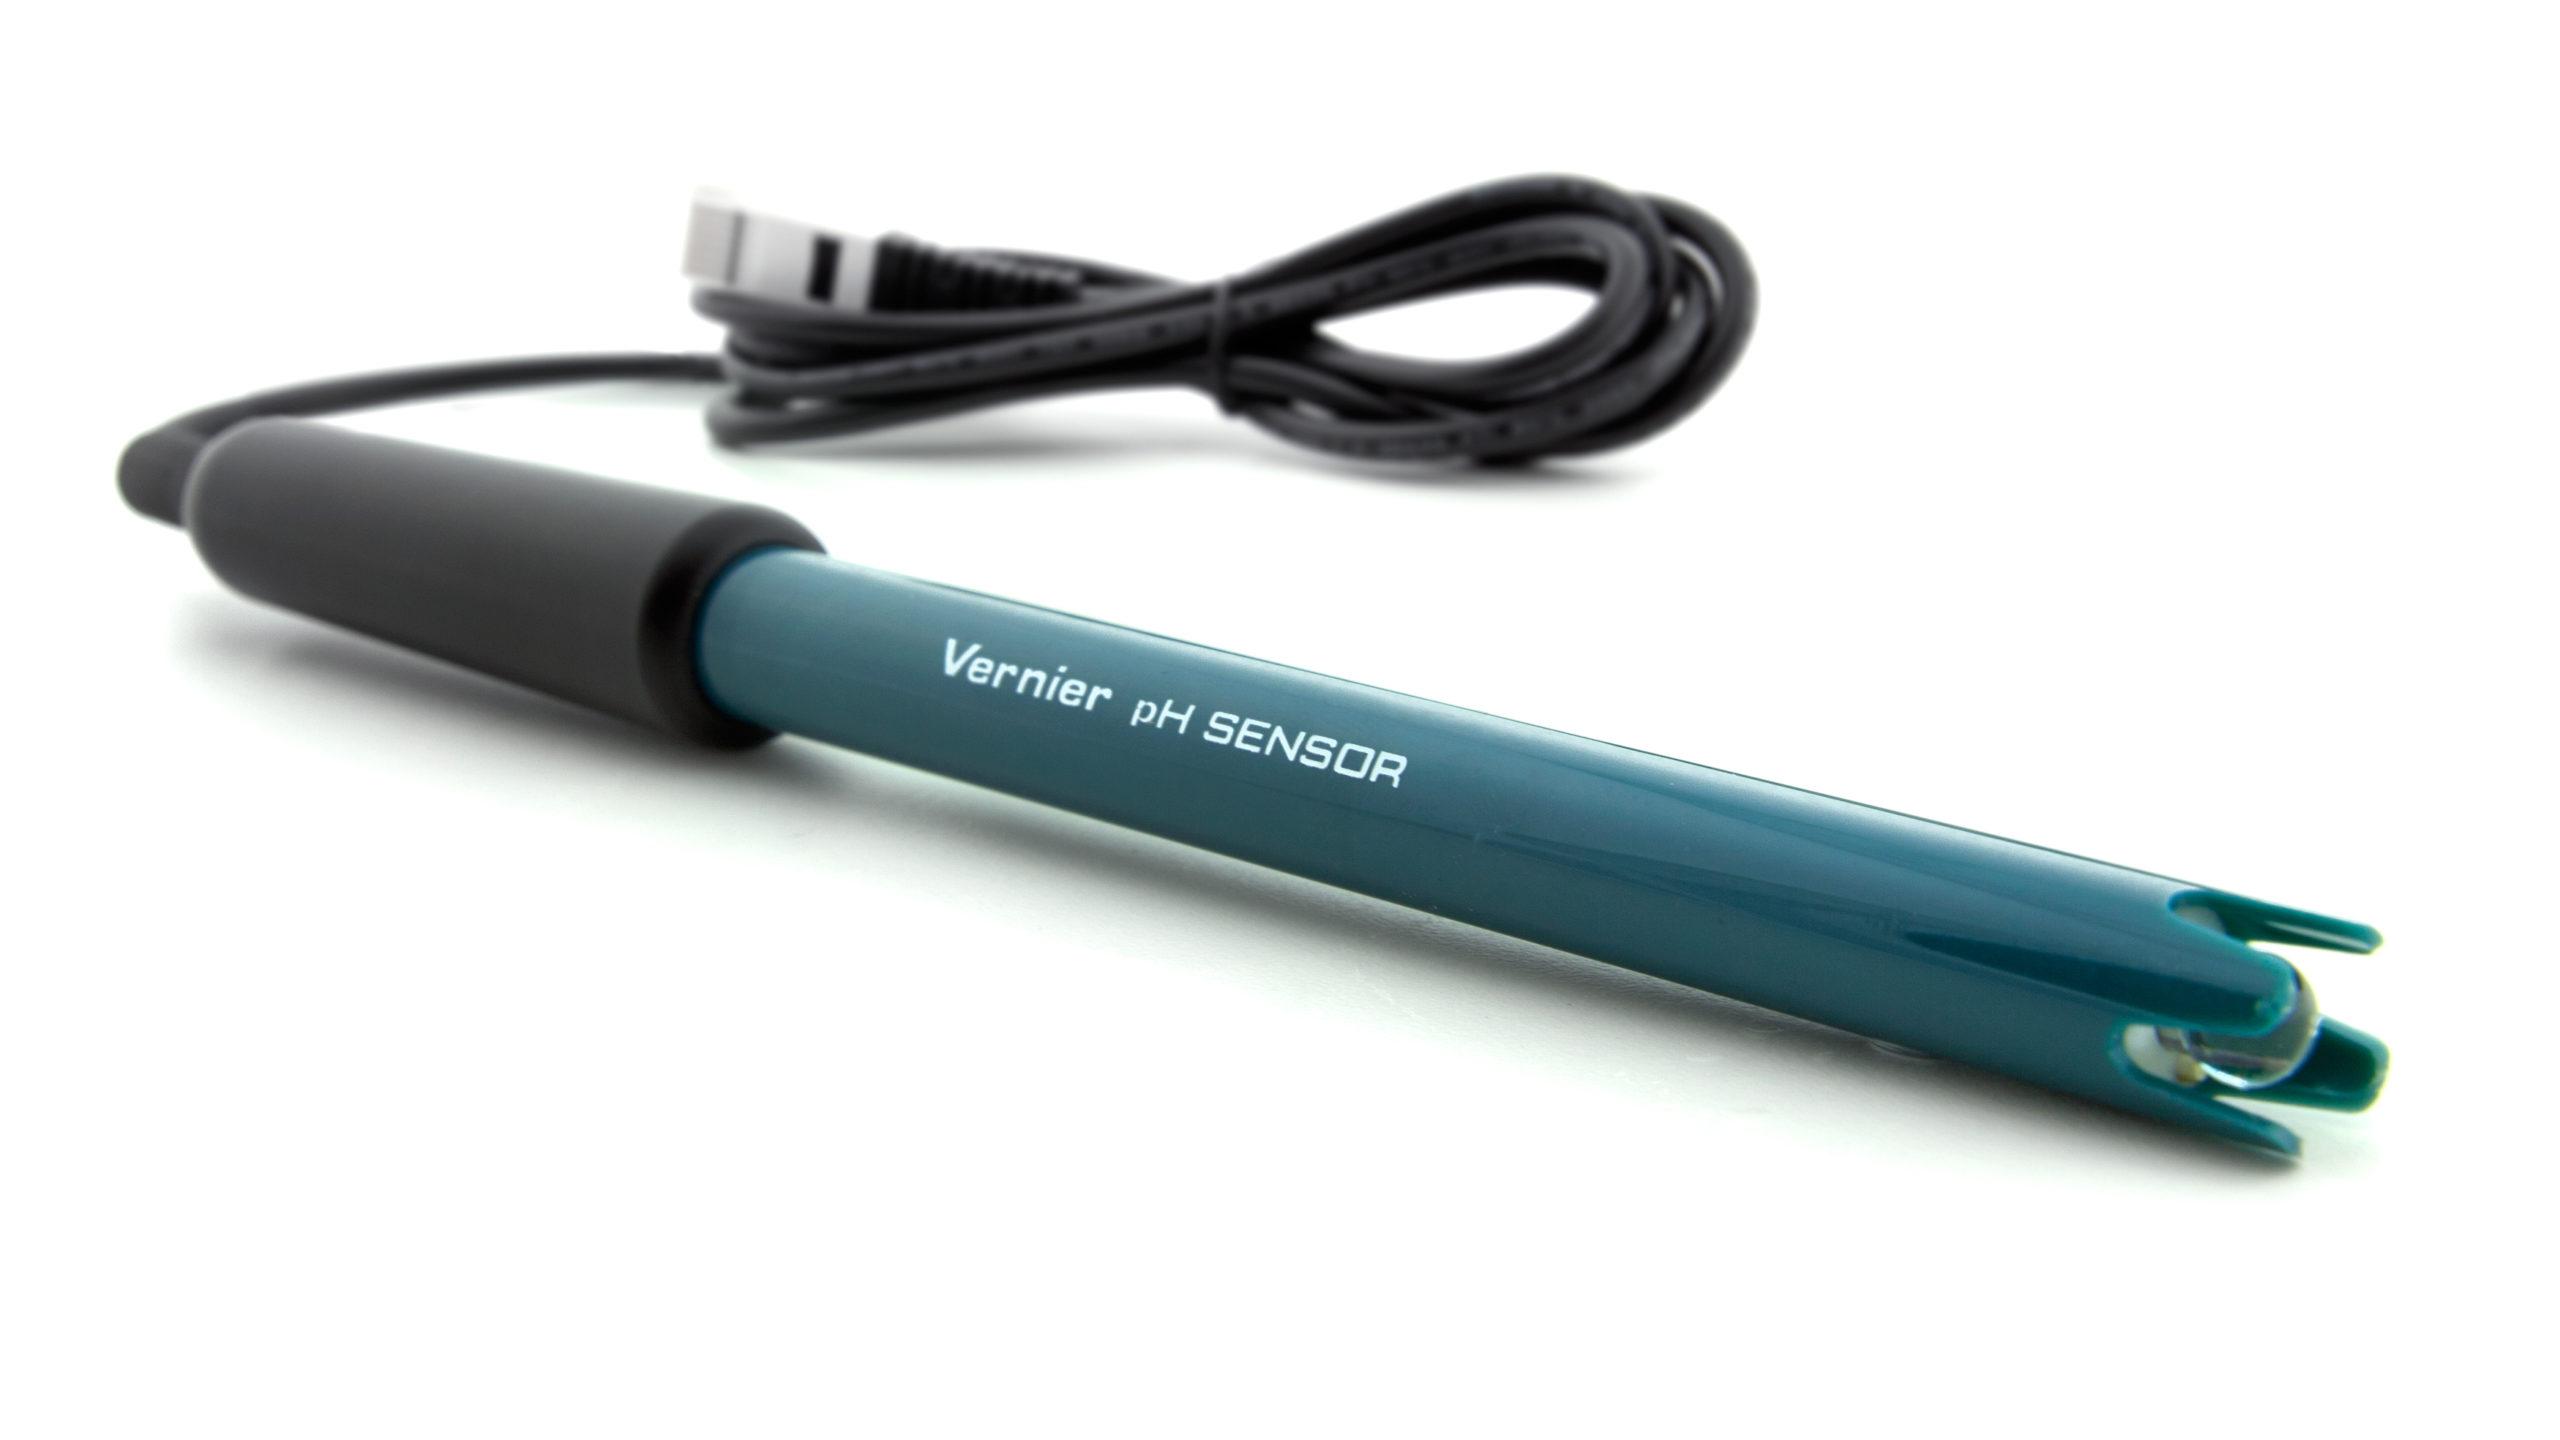
Sensors and Equipment
This experiment features the following sensors and equipment. Additional equipment may be required.
Option 1
Option 2
Ready to Experiment?
Ask an Expert
Get answers to your questions about how to teach this experiment with our support team.
- Call toll-free: 888-837-6437
- Chat with Us
- Email support@vernier.com
Purchase the Lab Book
This experiment is #23 of Chemistry with Vernier. The experiment in the book includes student instructions as well as instructor information for set up, helpful hints, and sample graphs and data.
