Introduction
Data collection is a very important part of science. Meteorologists collect weather data over time to keep an historical record and to help make forecasts. Oceanographers collect data on the salinity (saltiness) of seawater to study changing trends in our Earth’s oceans. While data have been collected by hand for thousands of years, the technology to collect data electronically was developed in the 1950s. Only since the 1980s has this technology been available and accessible to schools.
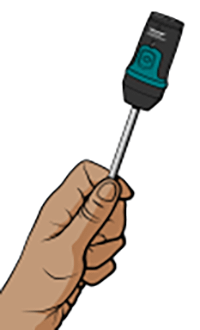
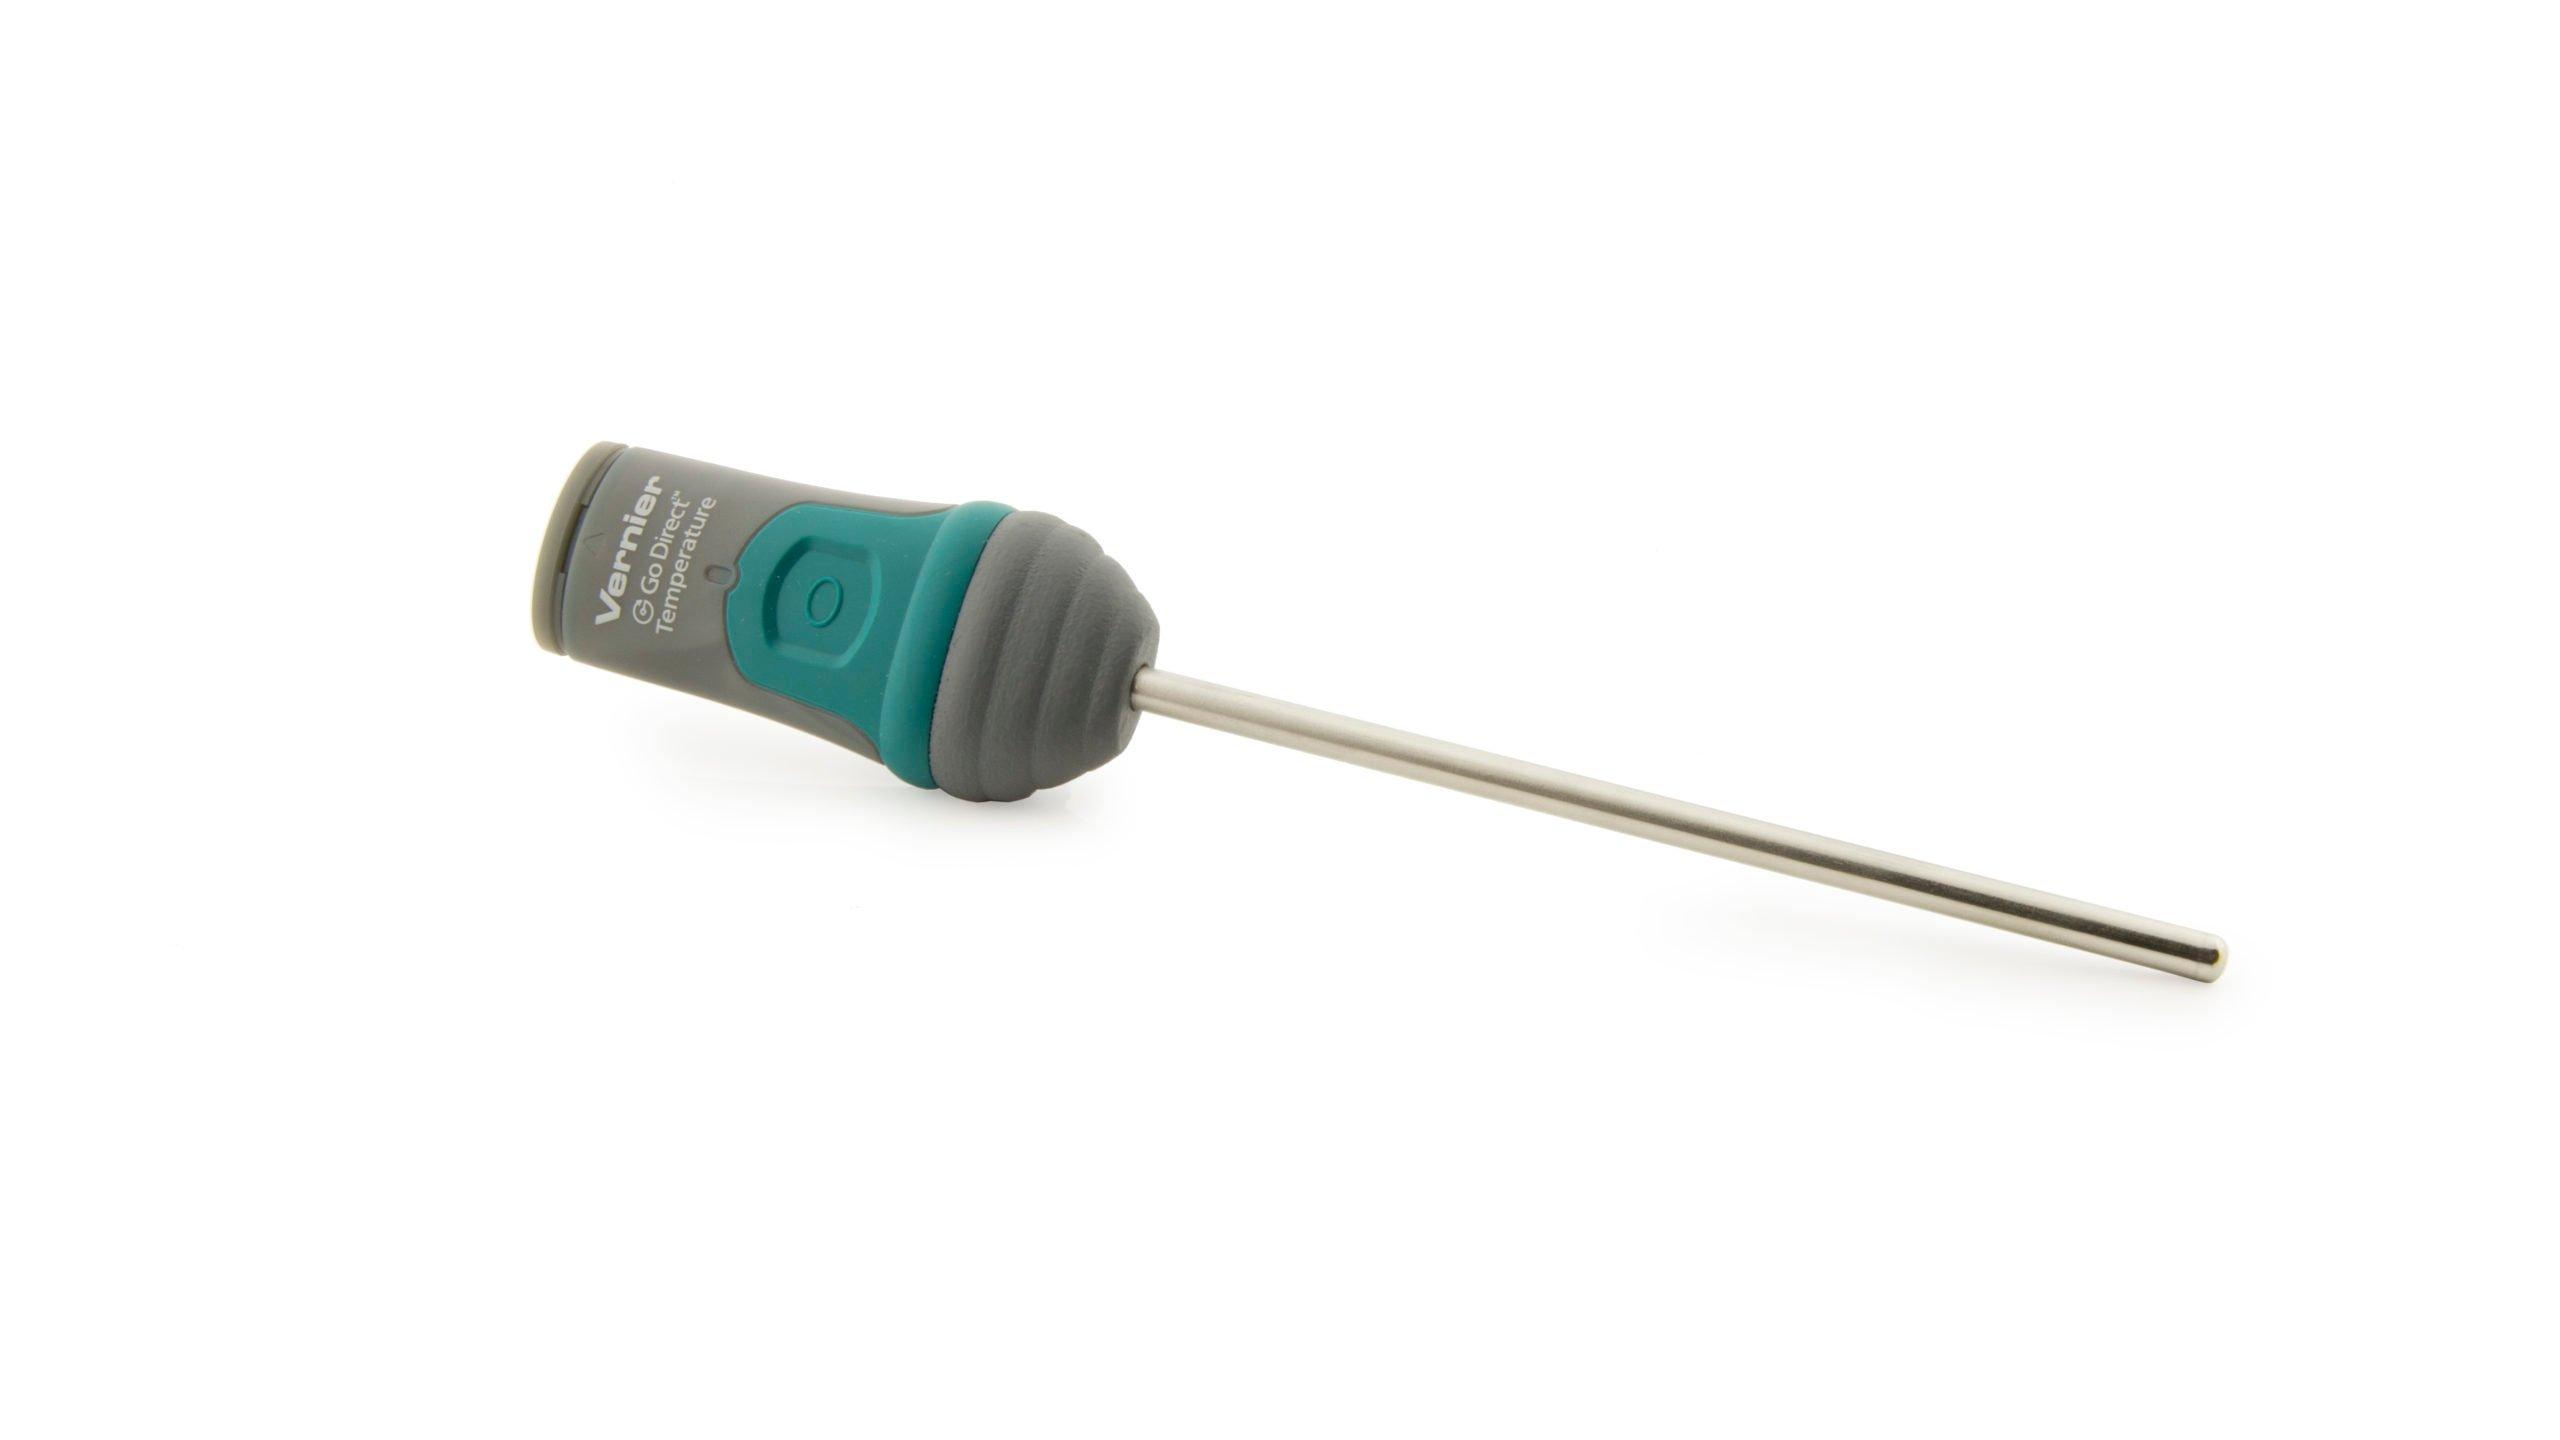
This experiment was designed to introduce you to two of the most common modes of data collection that will be used in this class. Part I will guide you through collecting and analyzing data over time. A temperature probe will be used to record the temperature of water for 60 seconds at a rate of one sample per second. In Part II, you will collect data using a mode called Events with Entry. This style of data collection allows you to collect one point of data, and then enter in a corresponding value. In this part, the data collected will be the temperature of your hand and the value you enter will be your assigned group member number.
Objectives
In this experiment, you will
- Become familiar with Graphical Analysis data-collection app.
- Use Graphical Analysis and a temperature probe to make measurements.
- Analyze a graph of the data.
- Use this graph to make conclusions about the experiment.
- Determine the response time of a temperature probe.
Sensors and Equipment
This experiment features the following sensors and equipment. Additional equipment may be required.
Ready to Experiment?
Ask an Expert
Get answers to your questions about how to teach this experiment with our support team.
- Call toll-free: 888-837-6437
- Chat with Us
- Email support@vernier.com
Purchase the Lab Book
This experiment is #1 of Earth Science with Vernier. The experiment in the book includes student instructions as well as instructor information for set up, helpful hints, and sample graphs and data.