Introduction
The respiratory cycle of inspiration and expiration is controlled by complex mechanisms involving neurons in the cerebral cortex, brain stem, and peripheral nervous system, as well as central and peripheral receptors. These receptors respond to a variety of stimuli including chemicals and pressure. Central respiratory control (respiratory drive) occurs in the pons and medulla, which respond directly to chemical influences. Other input is received from stretch receptors in the lungs and chemoreceptors located in the carotid and aortic bodies. The chemoreceptors respond most sensitively and rapidly to carbon dioxide but also to oxygen and pH (acidity). Constant adjustments in the respiratory cycle occur throughout the day to allow gas exchange in the lungs to maintain a steady level of CO2 in the bloodstream. An increase in the CO2 level stimulates breathing, while a decrease inhibits it. If the deviation from the “set point” is large enough you may experience shortness of breath. The oxygen level can also influence the respiratory cycle, but larger deviations are required before its influence is felt.
Objectives
In this experiment, you will
- Obtain graphical representation of normal tidal volume.
- Compare tidal volumes generated by various physiologic challenges.
- Correlate your findings with real-life situations.
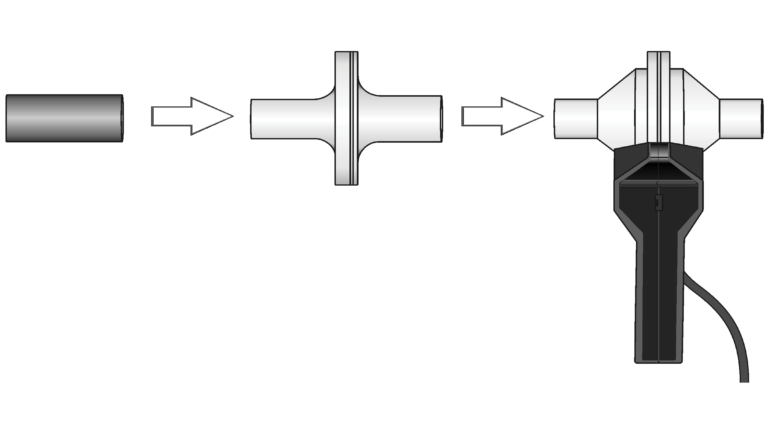
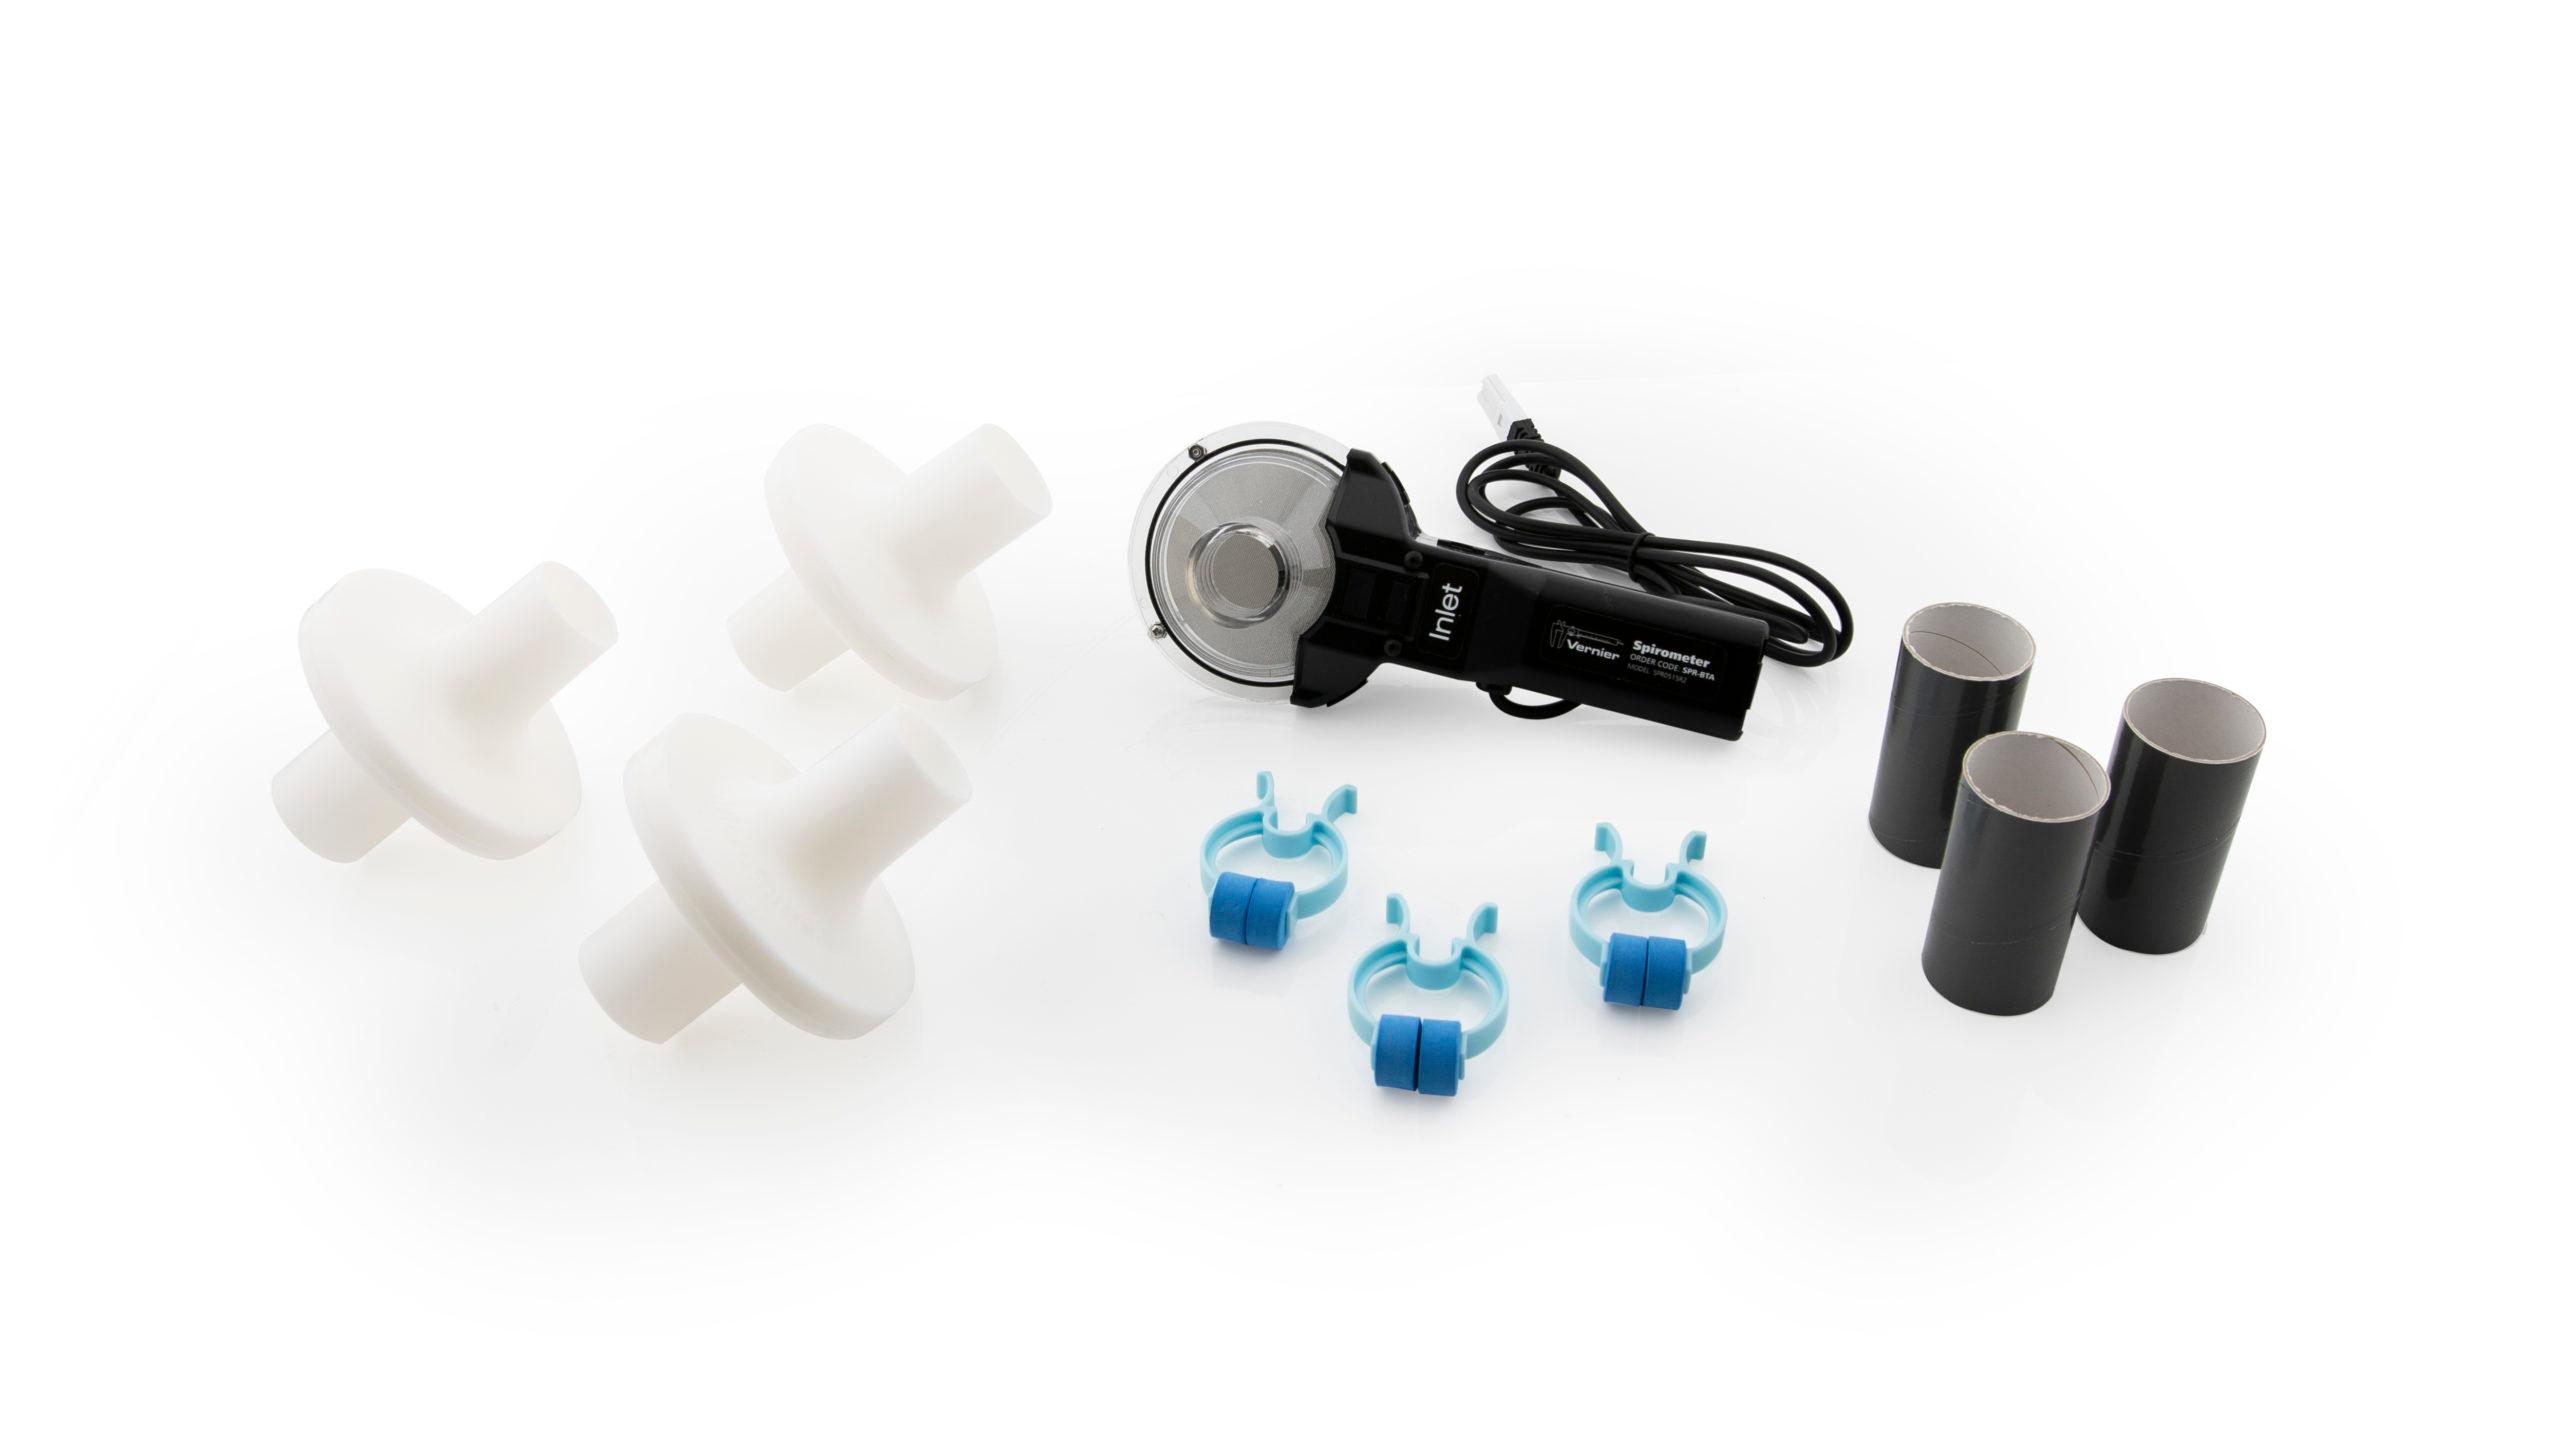
Sensors and Equipment
This experiment features the following sensors and equipment. Additional equipment may be required.
Ready to Experiment?
Ask an Expert
Get answers to your questions about how to teach this experiment with our support team.
- Call toll-free: 888-837-6437
- Chat with Us
- Email support@vernier.com
Purchase the Lab Book
This experiment is #20 of Human Physiology with Vernier. The experiment in the book includes student instructions as well as instructor information for set up, helpful hints, and sample graphs and data.