Introduction
This experiment uses an incline and a low-friction cart. If you give the cart a gentle push up the incline, the cart will roll upward, slow and stop, and then roll back down, speeding up. A graph of its velocity vs. time would show these changes. Is there a mathematical pattern to the changes in velocity? What is the accompanying pattern to the position vs. time graph? What does the acceleration vs. time graph look like? Is the acceleration constant?
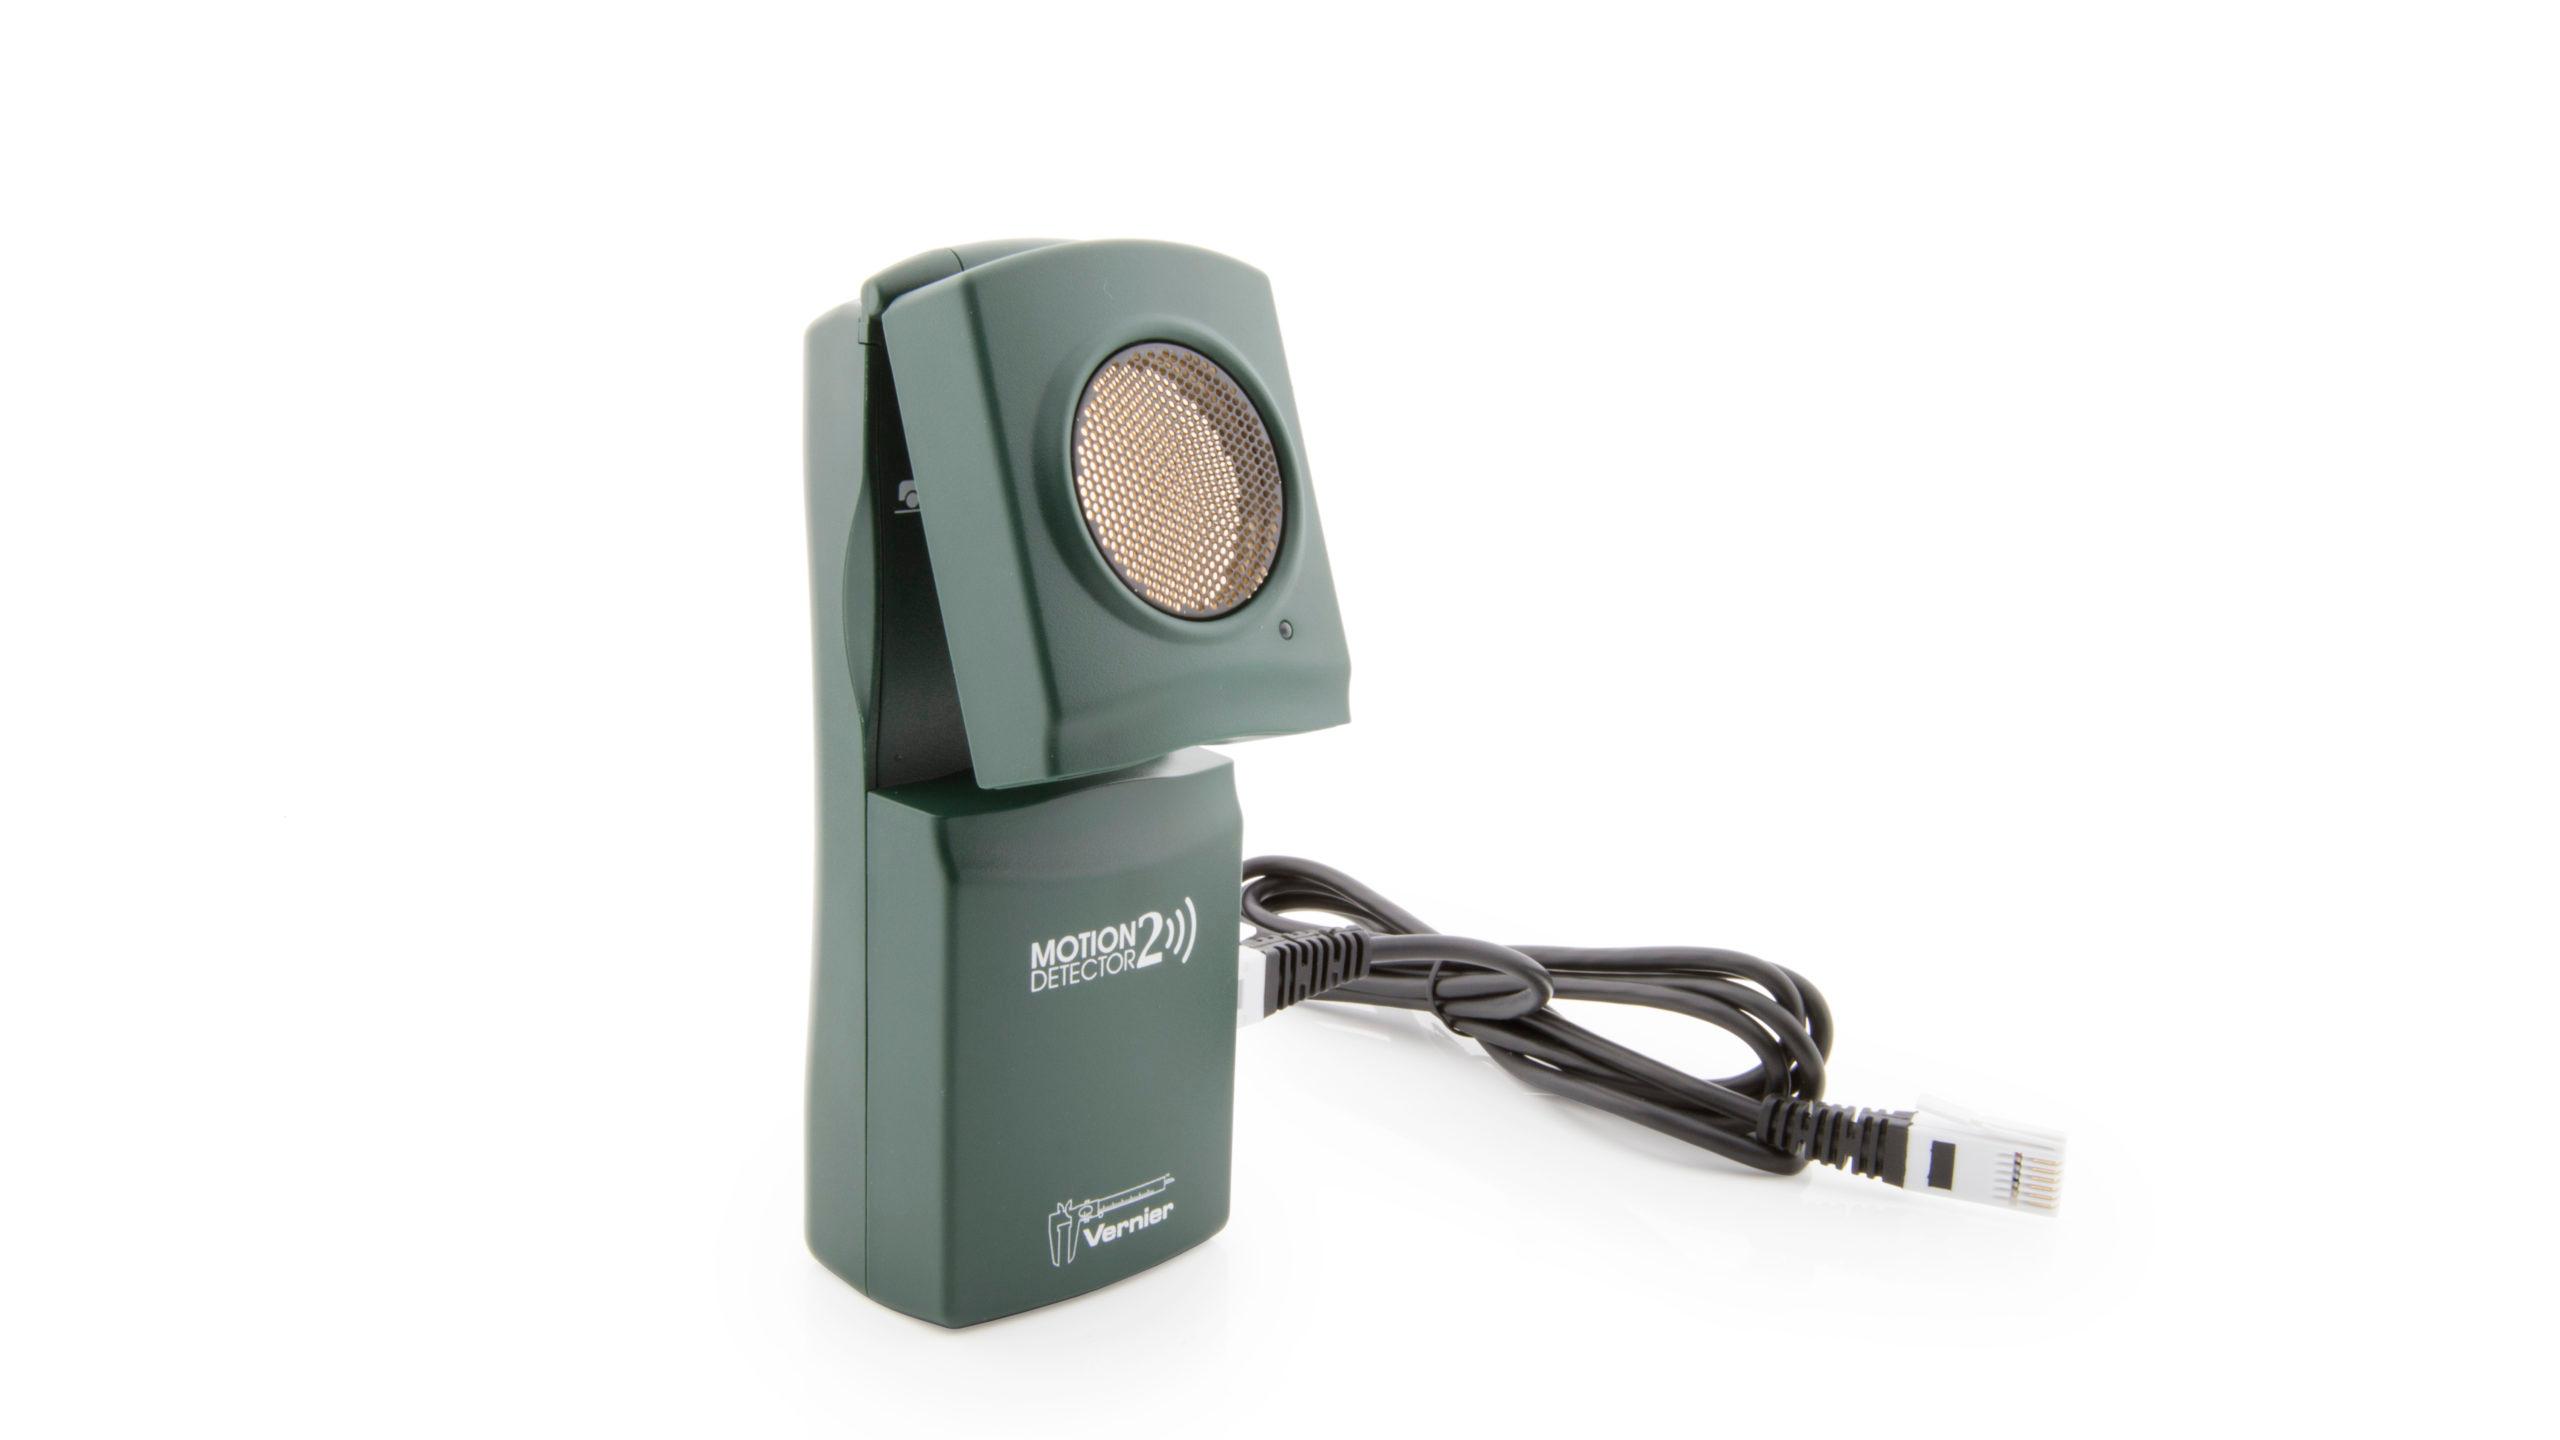
In this experiment, you will use a Motion Encoder System to collect position, velocity, and acceleration data for a cart rolling up and down an incline. Analysis of the graphs of this motion will answer these questions.
Objectives
- Collect position, velocity, and acceleration data as a cart rolls freely up and down an incline.
- Analyze position vs. time, velocity vs. time, and acceleration vs. time graphs.
- Determine the best fit equations for the position vs. time and velocity vs. time graphs.
- Determine the mean acceleration from the acceleration vs. time graph.
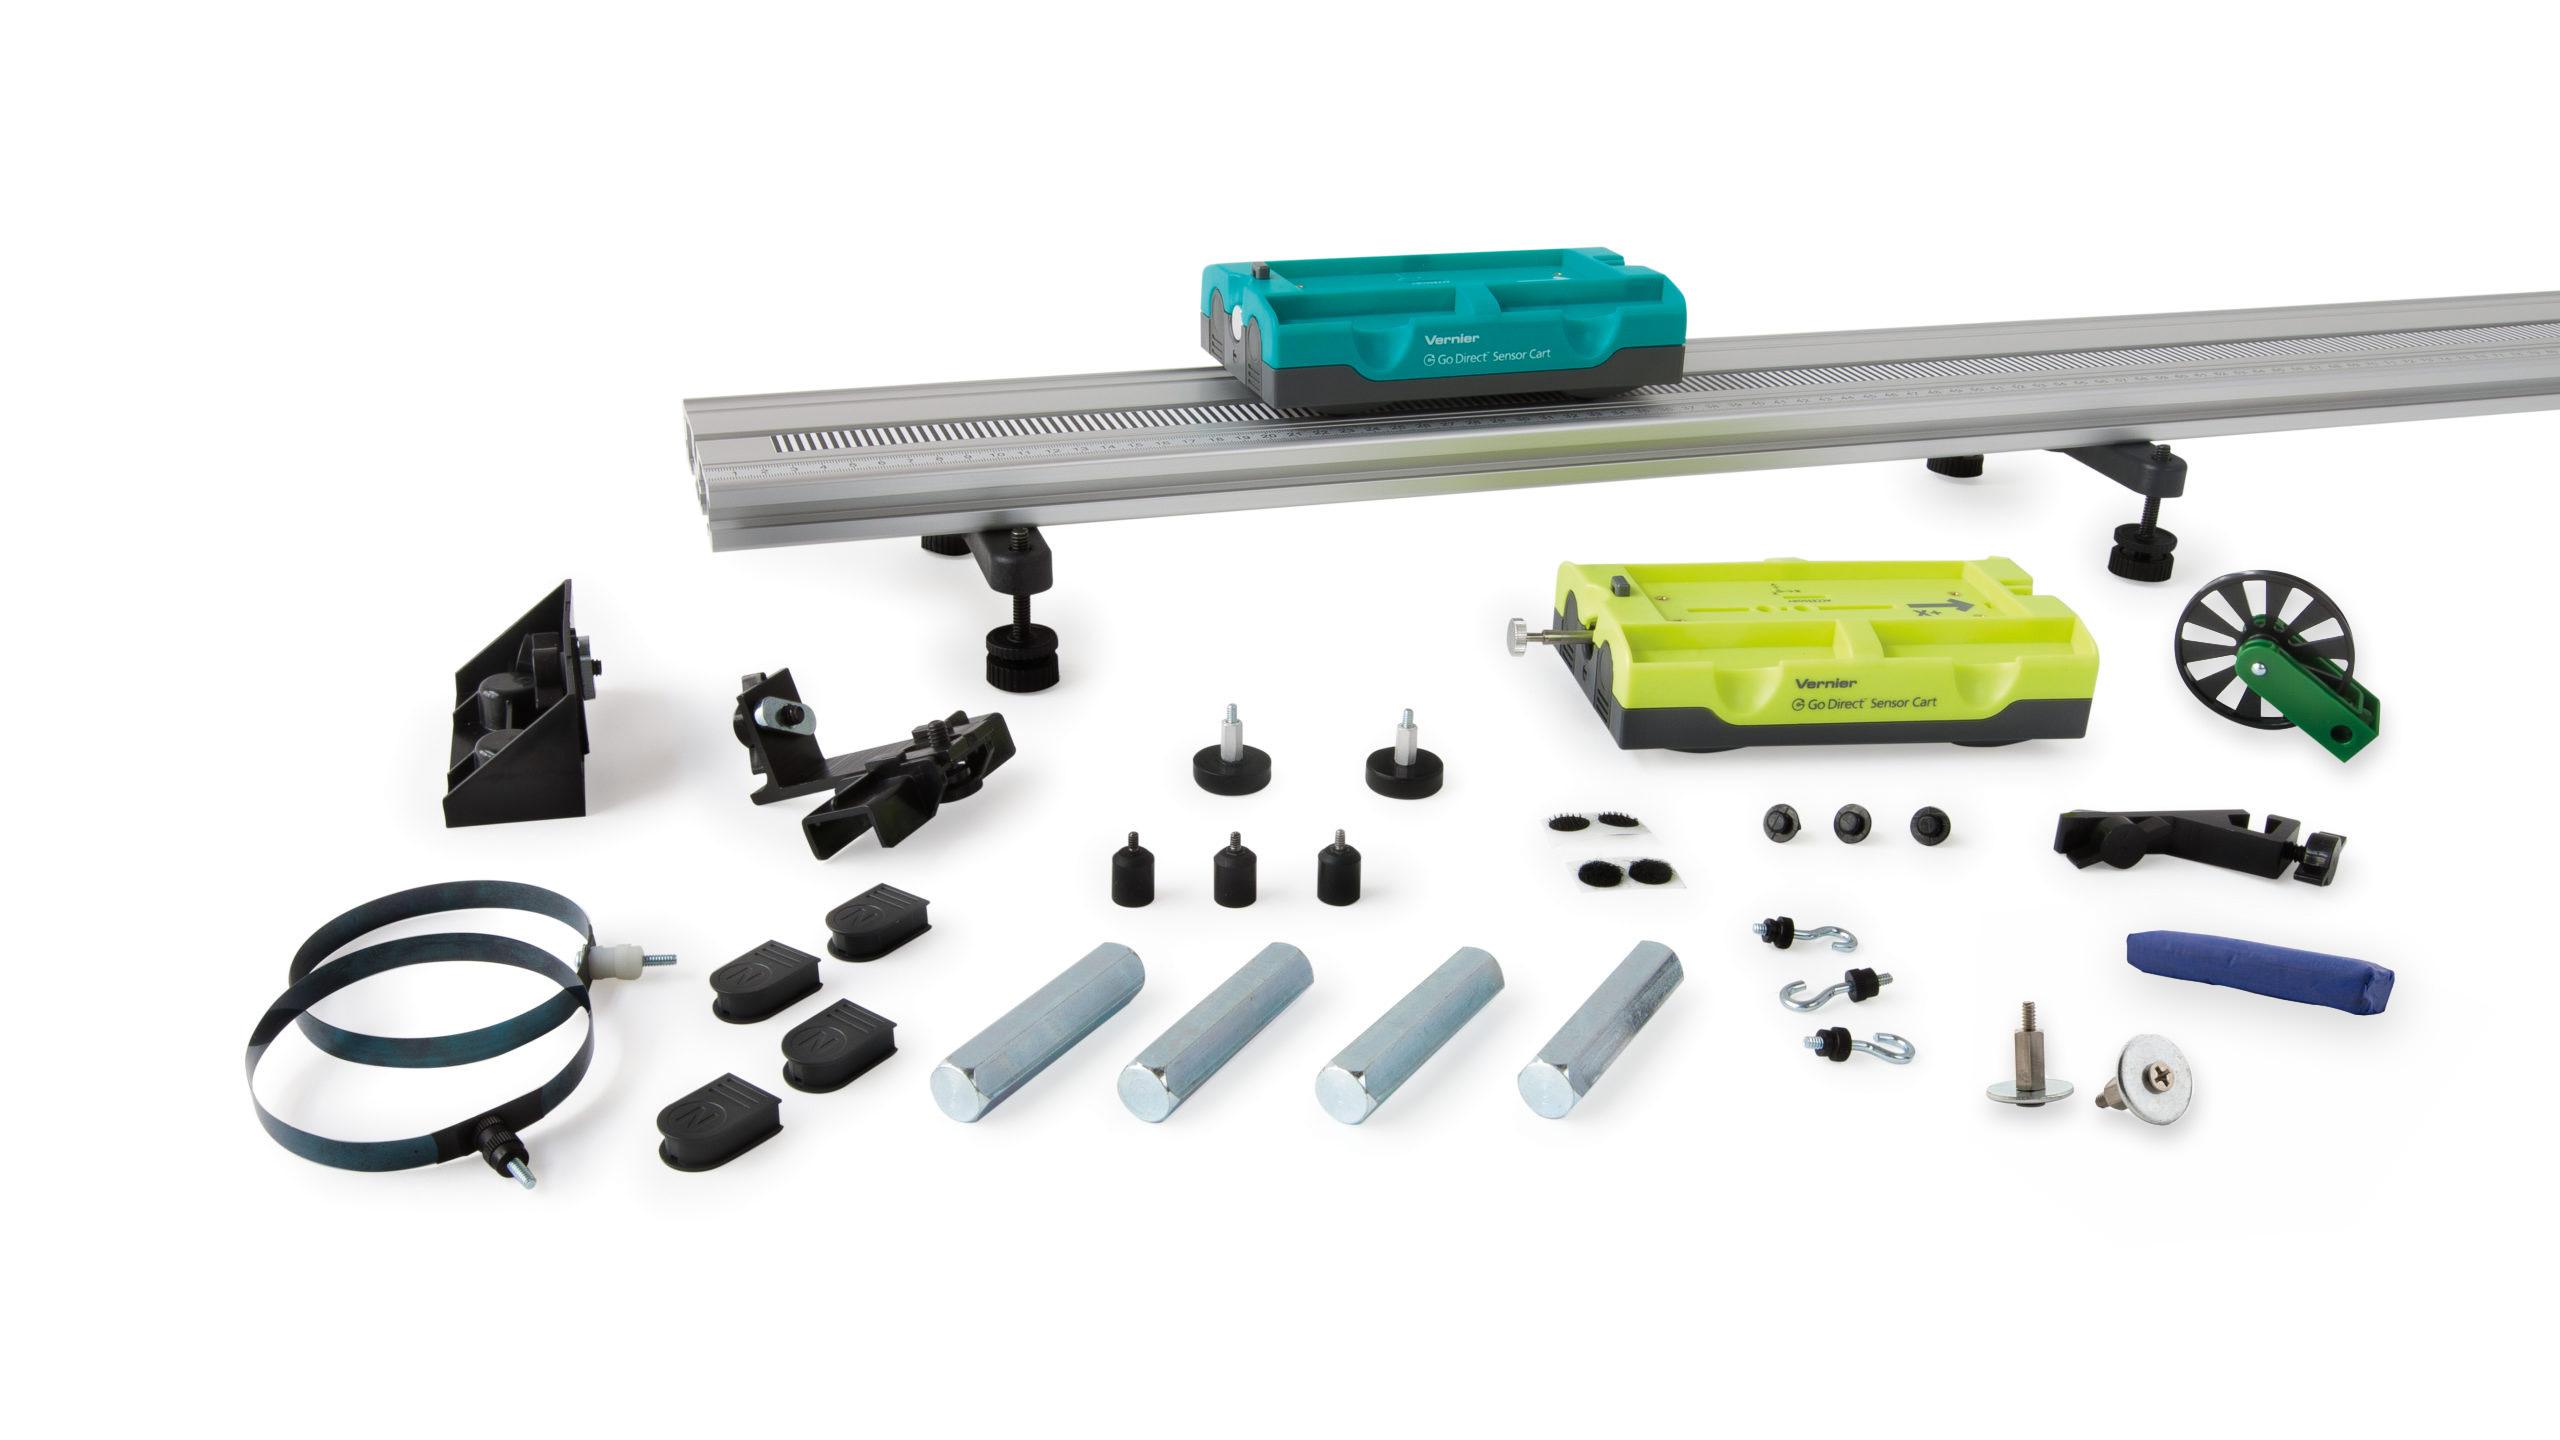
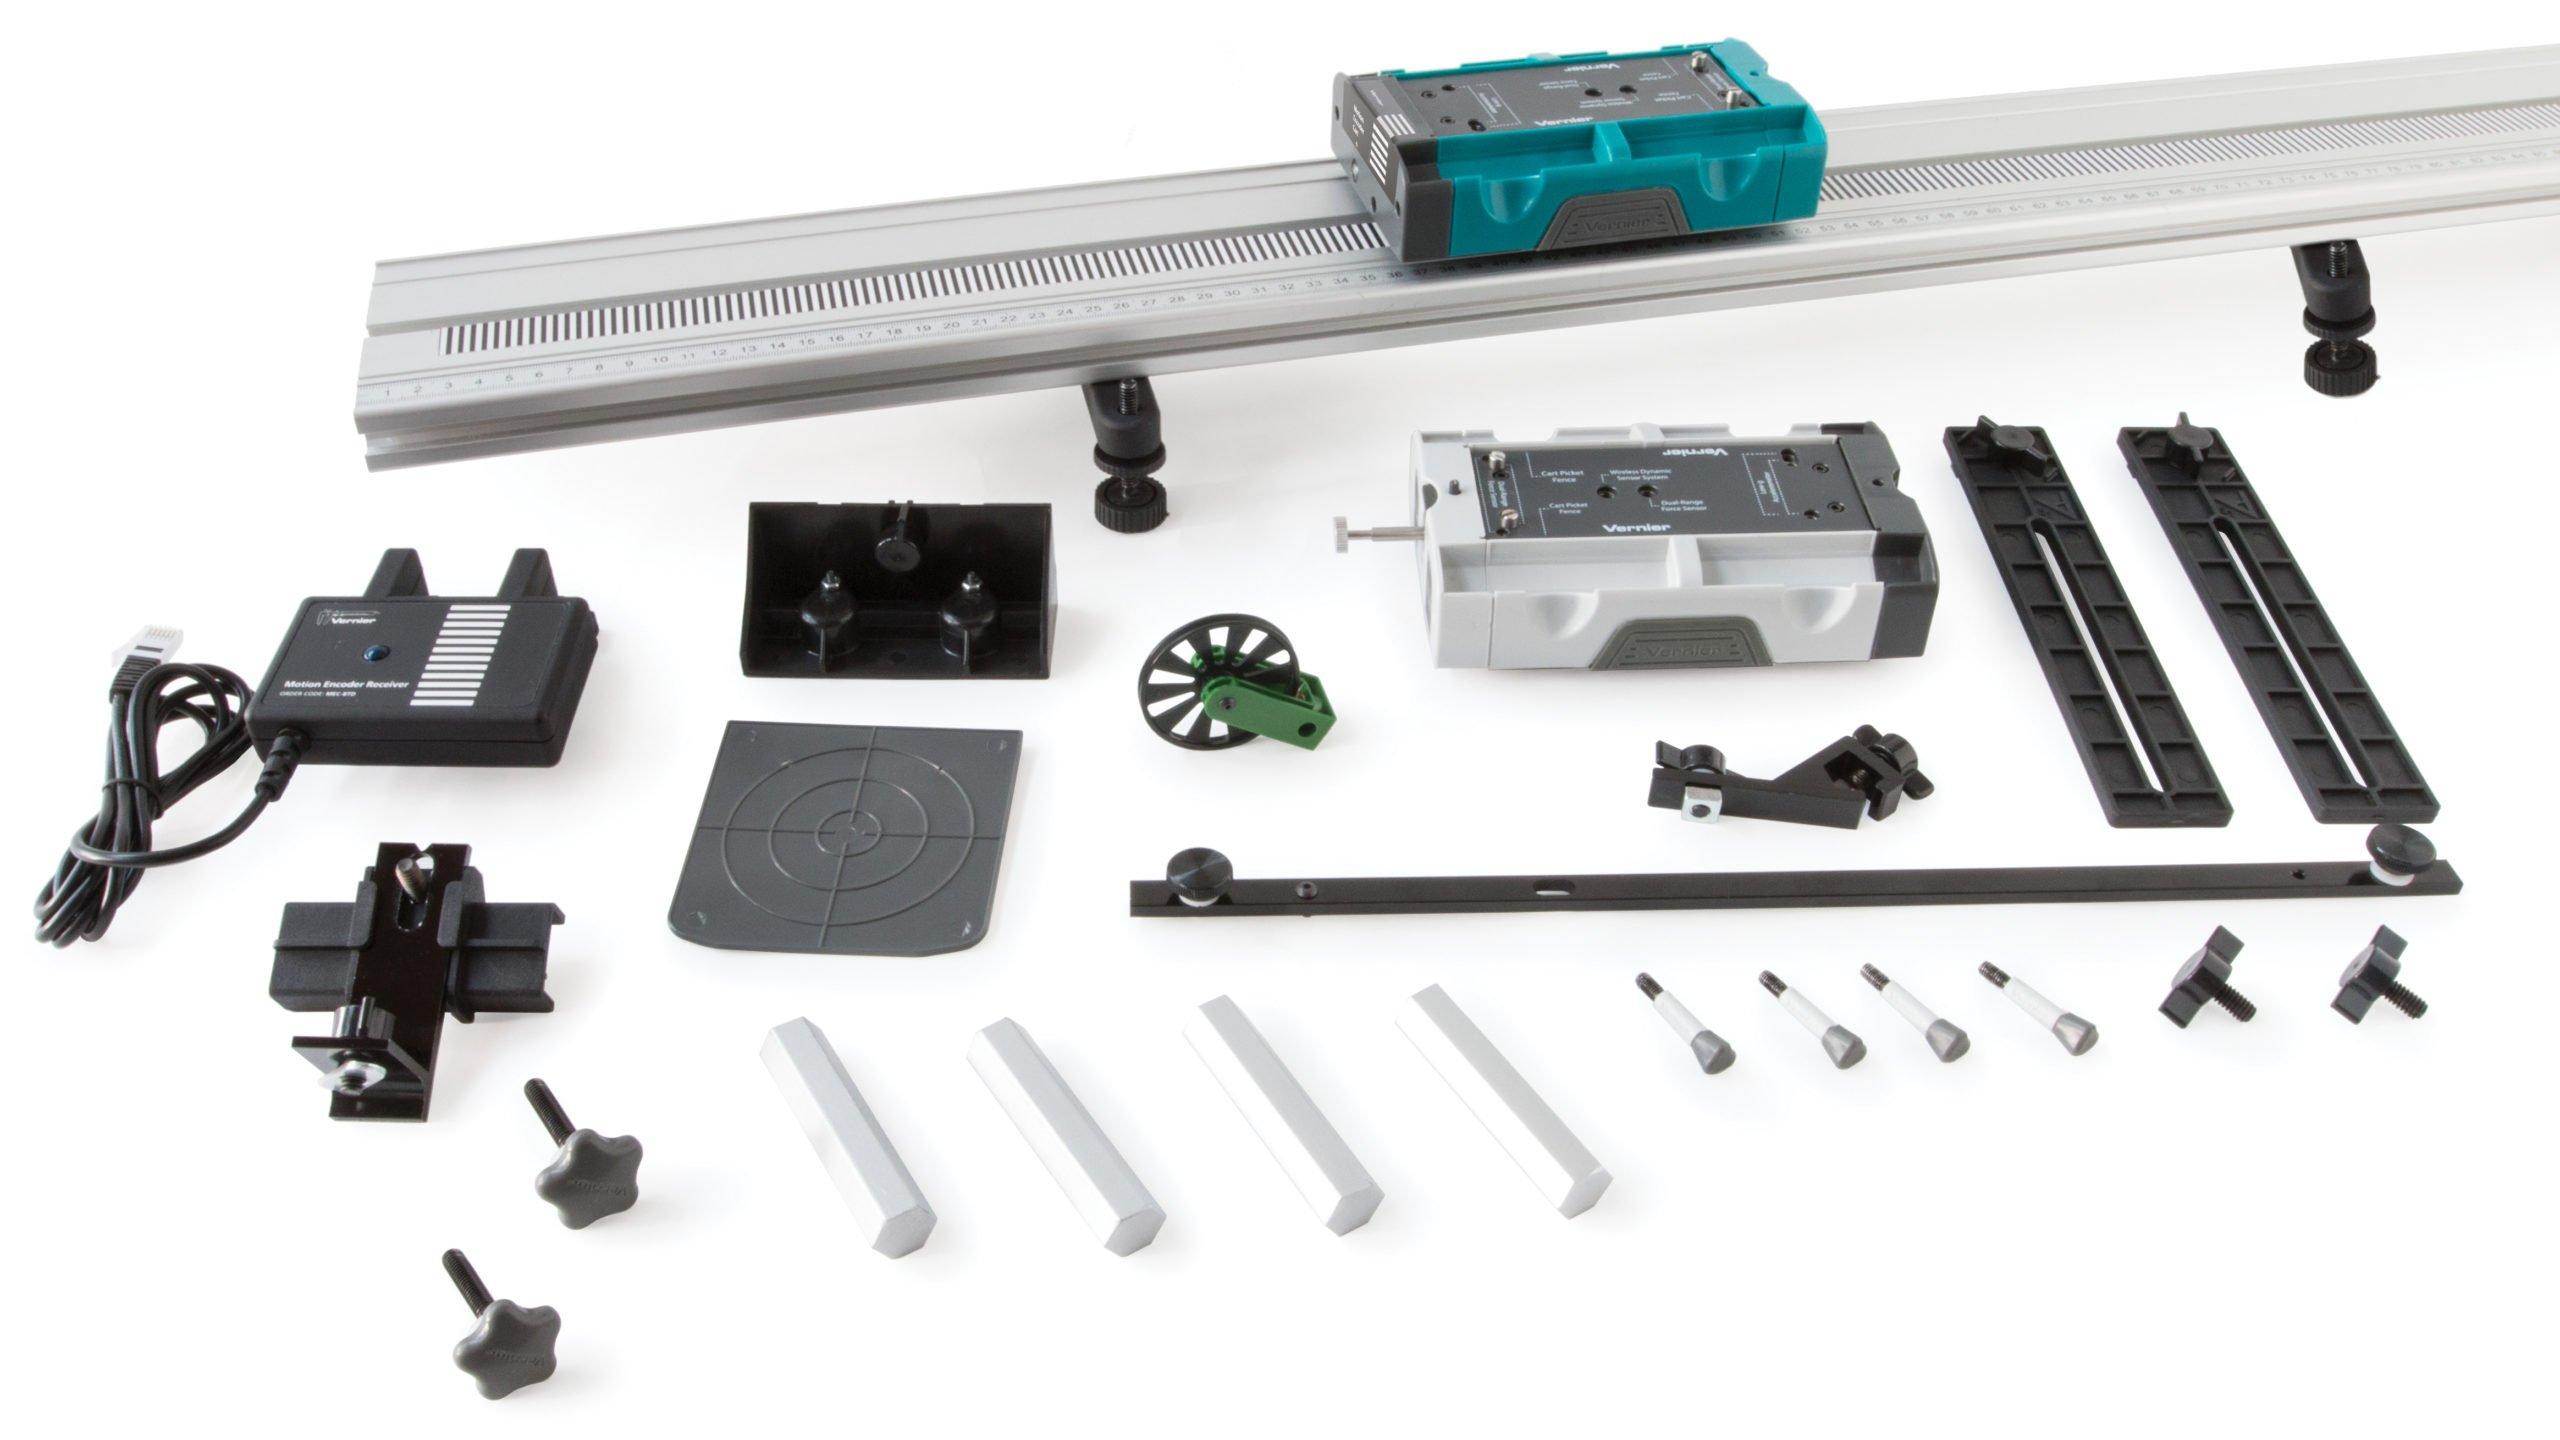
Sensors and Equipment
This experiment features the following sensors and equipment. Additional equipment may be required.


Ready to Experiment?
Ask an Expert
Get answers to your questions about how to teach this experiment with our support team.
- Call toll-free: 888-837-6437
- Chat with Us
- Email support@vernier.com
Purchase the Lab Book
This experiment is #3 of Physics with Vernier. The experiment in the book includes student instructions as well as instructor information for set up, helpful hints, and sample graphs and data.