The Power Amplifier (
RC, RL and RLC Circuits
Construct a series circuit of a resistor, capacitor and inductor. Drive the circuit with a sine wave, and measure the potential across various components. Study the phase and amplitude relationships between current and potential across components. The current and voltage graphs below were made with an RC circuit with a 4.7 μF capacitor, and a 100 Ω resistor. The frequency of the Power Amplifier was set to 319 Hz because that was calculated as the frequency where the current should be 45º out of phase with the voltage across the capacitor.
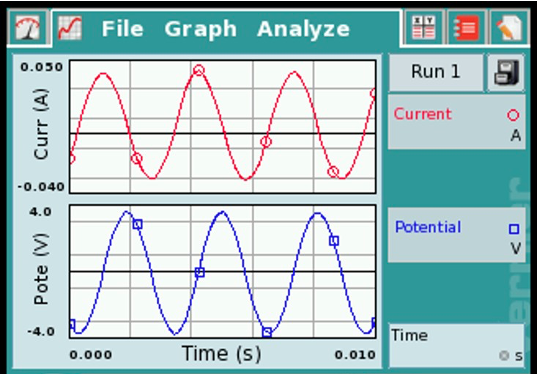
The current and voltage graphs below were made with an RLC circuit with a 0.067 H inductor, a 4.7 μF capacitor, and a 100 Ω resistor.
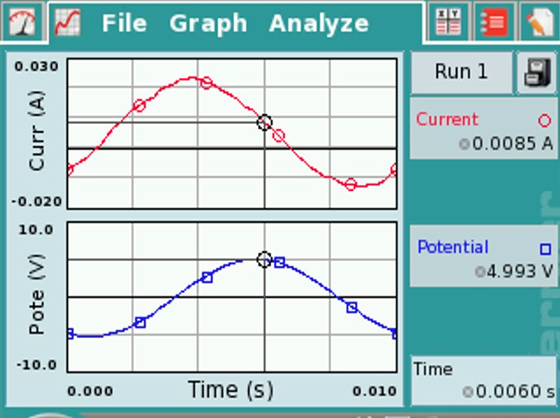
The calculations using the component values would predict that the current would lead the voltage by 70 degrees and the result matches this well.
Non-ohmic light bulb and Ohm’s Law
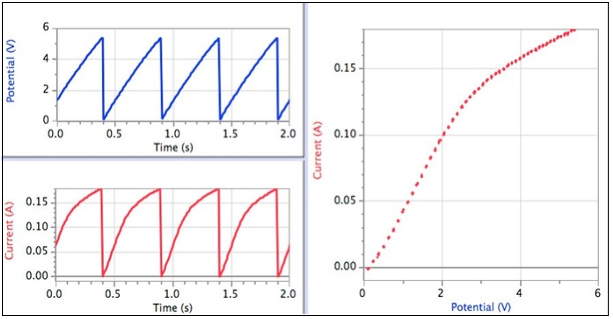
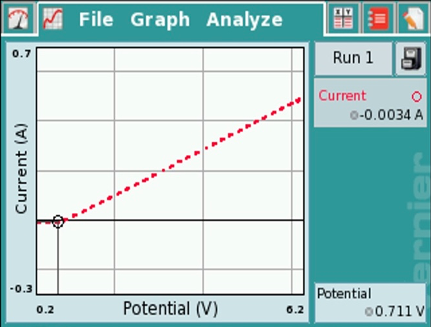
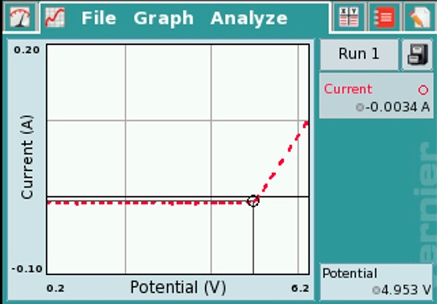
The ramp waveform can be used to quickly measure the I-V (current-voltage) characteristics of circuit components.
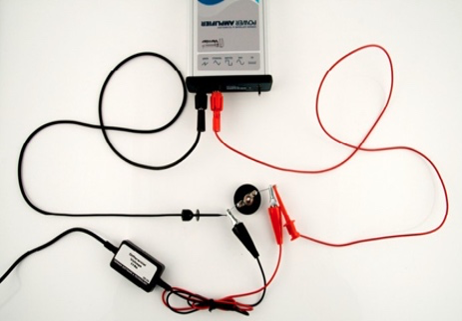
Connect the output of the Power Amplifier across a device such as a light bulb or resistor. Use Logger Pro or LabQuest App to plot the current through the component versus the potential across it. It is particularly interesting to compare a light bulb to a resistor.
Here are results using a #50 lamp. Note: The current vs. time graph does not match the potential vs. time graph. At the right is a graph of the current vs. potential, showing the non-linear (non-ohmic) behavior of the lamp.
Resonance Experiments Using the Power Amplifier Accessory Speaker
Vernier sells an accessory speaker for use with the Power Amplifier Accessory Speaker (
Observing standing waves and harmonics
- Place the speaker on the table and connect the Power Amplifier.
- Attach the threaded hook screw to the driver plate. (Note: A small spacer is included with the equipment. It can be placed between the hook screw and the driver plate to elevate the hook screw.) Attach the elastic string to the hook screw.
- Attach the other end of the elastic to a ring stand.
- Move the speaker box to create tension in the string.
- Use the software to generate a sine wave with a 4 V amplitude and a frequency of around 15 Hz.
- Adjust the tension in the string until you have a standing wave for the fundamental frequency.
- Double the frequency. Describe the change in the standing wave.
- Triple the fundamental frequency. Describe the change in the standing wave.
- Try quadrupling the frequency.
Measuring the speed of a wave on an elastic string
- Place the speaker on the table and connect the Power Amplifier.
- Attach a Force Sensor to a ring stand.
- Attach the threaded hook screw to the driver plate.
- Attach the elastic string to the hook screw post on the speaker.
- Attach the other end of the string to the force sensor.
- Move the speaker box to create tension in the string.
- Use the software to generate a sine wave with an amplitude of 4 V and a frequency about 15 Hz.
- Adjust the tension in the string until you have a standing wave of the fundamental frequency.
- Use the data-collection software to determine the tension in the string.
- Knowing that the speed of the wave is equal to frequency multiplied by the wavelength, determine the speed of the wave.
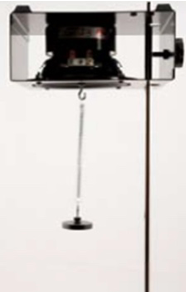
Observe resonance on a spring
- Attach the threaded hook screw to the driver plate.
- Attach the speaker to a ring stand with the speaker facing down.
- Attach one end of the spring to the hook screw on the speaker.
- Attach a weight to the other end of the spring.
- Knowing the spring constant of the spring and the mass of the weight, calculate the period and frequency with which the mass will oscillate.
- Use the software to generate a sine wave with an amplitude of 4 V and a frequency of about 1 Hz. Observe the motion of the mass.
- Increase the frequency slightly, e.g., 0.2 Hz. Observe the motion of the mass.
- Continue to increase the frequency and approach the frequency calculated in Step 4 above.
- Describe the motion of the weight when that frequency is reached.
- Repeat the above with another spring and weight combination.
Current vs. Voltage plots for electronic components
The triangle waveform can be used to quickly measure the I-V (current-voltage) characteristics of other electronic components such as diodes, Zener diodes, and transistors. Below are sample graphs made using a diode and a Zener diode.
Bicolor LEDs
Inexpensive bi-color, red/green, LEDs can be driven by the Power Amplifier at various frequencies to show several interesting effects. The LED should be placed in series with a current-limiting resistor, usually a few hundred ohms. The LED will glow red when the current flows one way and green when the current flows the other way. The triangle waveform can be used to drive the LEDs. At low frequencies, the transition can be clearly seen. At higher frequencies the LED appears orange. It is interesting to explore how high the frequency needs to be to trick the eye into seeing just one color. Try moving the bicolor LED quickly while it is being driven by a triangle or sine waveform to see an interesting visual effect. Can you explain what you see?
Use the Power Amplifier as a DC power supply
The Power Amplifier can supply a DC voltage up to 10 V and a current up to 1 A. It can take the place of a DC power supply and offer the advantage of computer control.
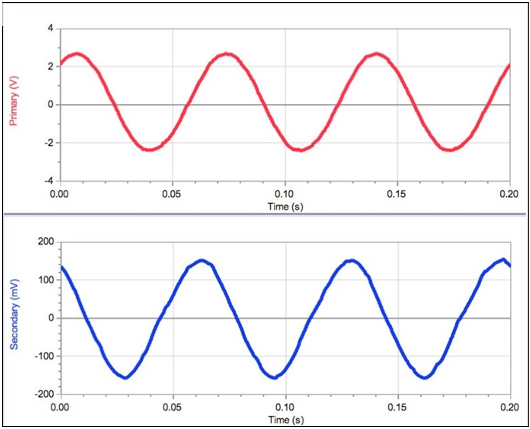
Induced currents in a coil
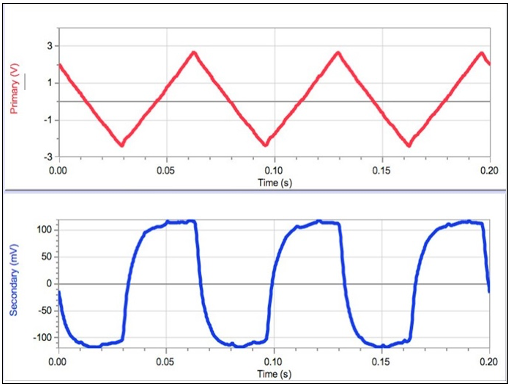
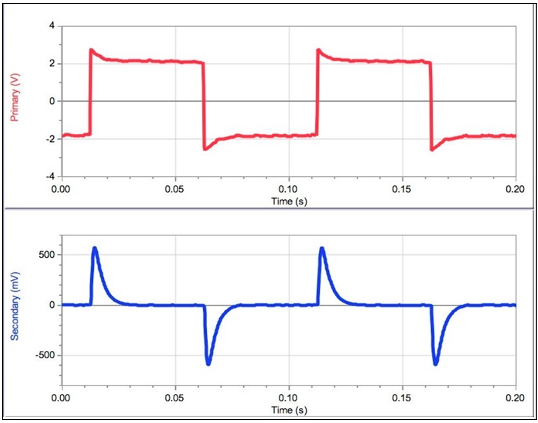
Drive a primary coil with a triangle wave, square wave, or sine wave, and measure the induced potential in a secondary coil. The induced potential is proportional to the rate of change of the current in the primary coil, which means that the coil pair is essentially a machine that finds the derivatives of waveforms.
In these three examples, the potential across the output of the Power Amplifier and primary coil was measured with a Vernier Differential Voltage Probe (DVP-BTA) and the potential across the secondary coil was measured with a Vernier Instrumentation Amplifier (INA-BTA). A second Differential Voltage Probe or the simple Voltage Probe (VP-BTA) could be used instead, but readings will be noisier than those obtained with the Instrumentation Amplifier.
In the example below, a large coil was driven by a sine wave output from the Power Amplifier. A small coil inside the first one has a voltage waveform induced in it. Note that the induced waveform is 90 degrees out of phase with the driving waveform.
Another good demonstration using two coils is to drive the primary with a triangular waveform. What is the waveform of the induced potential?
A square wave is also interesting to study:
Some things to investigate with this apparatus are:
- How does the amplitude of the induced potential depend on the waveform frequency in the primary?
- How does the amplitude of the induced potential depend on the waveform amplitude in the primary?
- How does the shape of the secondary waveform depend on the primary waveform?
- Do you see signs of self-inductance from the primary coil? Hint: compare the waveform from the Power Amplifier with and without the coil connected.
Related TILS
Power Amplifier Troubleshooting and FAQs