There are two critical steps to being able to open a .csv data file in Graphical Analysis. The first has to do with the format of the data, and the second has to do with a subtle change required to “see” the .csv file from within Graphical Analysis.
Graphical Analysis expects a header to each column of data with the form: Data Set 1: Data_name. For example, the headers of the columns of data set that contains time and position data may look like this:
Data Set 1: Time(s) and Data Set 1: Position(m)
The presence of “Data Set 1: ” is critical. In order to confirm that the data set is in the correct format is to open the csv file in a spreadsheet. If the header, isn’t in the right format change it and save the file.
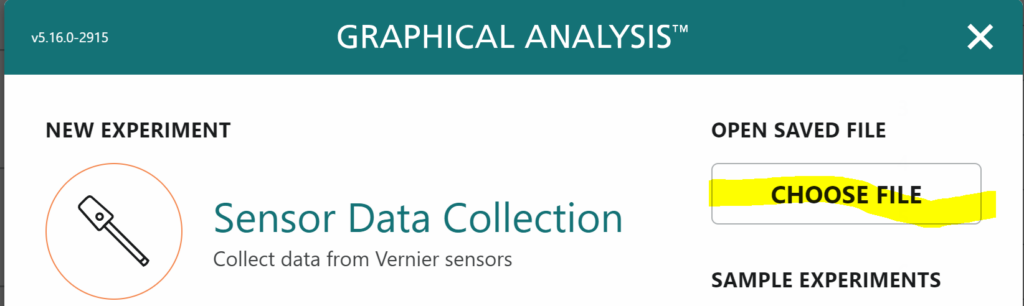
In order to open the file from Graphical Analysis, click on Choose File from the New Experiment menu.
Navigate to the location of the file and then change the file format from Vernier Graphical Analysis (*.gambl… ) to Comma Separated Values (*.csv)
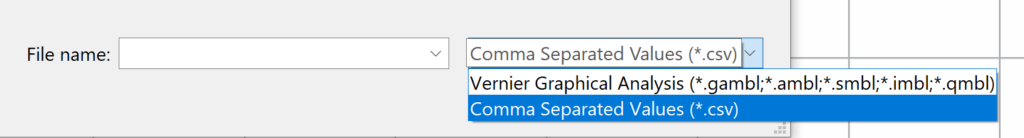
You will then be able to select the .csv files in that file location.
Once you have opened the file, you can expose the data table using the View icon. You may have to select what data are displayed using the plot manager on the x and y axes.
Troubleshooting – if you have no data when you open the file:
- Check to make sure your header is in the correct format. Remove any unnecessary punctuation.
- If you create data in a program and add line breaks, verify that the last data in the .csv file is followed by a line break.
- Start with data collected in Graphical Analysis and export it as a .csv file in order to compare the format that Graphical creates and match it.