The X-axis Balance and Y-axis Balance sensor channels of the Go Direct® Force Plate (
Some things to test
- Compare the relative stability for test subjects standing with eyes open vs. eyes closed.
- Compare the relative stability for test subjects standing with arms down at their sides vs. arms extended (in various directions).
- Compare the relative stability for test subjects standing on one foot (one foot vs. two feet, left foot vs. right foot, and with eyes opened vs. eyes closed).
Instructions for setting up and collecting data
Expand the section that matches the software you are using, then follow the instructions provided.
Set up the Sensor Channels
- Launch Graphical Analysis, choose Sensor Data Collection, and connect your sensor.
- From the Sensors dialog box, click or tap Sensor Channels to view the sensor channel options.
(If the Sensors dialog box is not showing, click or tap Sensor Setup, , to display the dialog.)
 - Turn on the X-axis Balance and Y-axis Balance channels and turn off the Force channel.
(The Balance sensor channels are only available when the Go Direct Force Plate’s User Profile is configured for Physiology. If the list of sensor channels does not include the X-axis and Y-axis Balance channels, you will need to reconfigure your Go Direct Force Plate. For instructions, see How do I switch between Physics and Physiology Sensor Channels on my Go Direct Force Plate?) - Click or tap
 to set up the sensor.
Adjust the Settings
- Click or tap Mode and change the sample rate to 10 samples per second and the end collection duration to 60 seconds.
- Click or tap View Options,
 , and turn on Meters.
 - Click or tap the x-axis label,
 , and select to plot X-axis Balance on this axis.
 - Click or tap the y-axis label to access the plot manager. Adjust the selection so that only Y-axis Balance is selected.
- Click or tap Graph Options,
 , select Edit Graph Options, then make the following changes:
- Under Appearance, turn on Points and turn off Lines.
- Change the x-axis range to -100 (Left) and 100 (Right).
- Change the x-axis Scaling to Manual.
- Verify the Left y-axis range is -100 (Bottom) and 100 (Top). Make changes if necessary.
- Change the Left y-axis Scaling to Manual.
- Click or tap Close, ✖.
- Adjust the width of the graph to make the boxes marking the regions on the graph squares and not rectangles.
Calibrate the Balance Channels
- Have the test subject stand in the middle of the force plate. The test subject’s toes should be pointing towards the side of the Force Plate where the power button and USB port are located.
- Click or tap either the X-axis or Y-axis Balance meter (located on the bottom bar next to ), and select Calibrate. (Note: both channels are calibrated at the same time.)
- Remind the test subject to remain still while the sensor calibrates, then click or tap Calibrate Now and wait for the sensor calibration to complete (~10 seconds).
- Click or tap to complete the calibration.
Collect and Analyze Data
- Have the test subject stand on the Force Plate with their toes pointing towards the side of the Force Plate where the power button and USB port are located.
- Click or tap
 , and allow data collection to complete. The pattern on the graph will show the relative stability of the test subject as they stand on the force plate.
 - Click or tap Graph Options, , and select View Statistics. The standard deviation (Std dev) of the Y-axis Balance can be used to quantify relative stability.
- Click or tap Graph Options, , and select View Integral. The integral value can also be used to quantify relative stability.
- Repeat steps 16−19 varying the conditions of the test (eyes closed, standing on one foot, etc.). Data from previous trials are automatically saved.
- Repeat steps 12−20 when testing different subjects.
Set up the Sensor Channels
- Turn on your LabQuest and choose New from the File menu.
- Connect your sensor to your LabQuest. (To connect the sensor via Bluetooth, choose Wireless Device Setup from the Sensors menu, then select Go Direct. Select your sensor from the list of available sensors.)
- Tap the Force meter and select Sensor Channels.
- Turn on the X-axis Balance and Y-axis Balance channels and turn off the Force channel.
(The Balance sensor channels are only available when the Go Direct Force Plate’s User Profile is configured for Physiology. If the list of sensor channels does not include the X-axis and Y-axis Balance channels, you will need to reconfigure your Go Direct Force Plate. For instructions, see How do I switch between Physics and Physiology Sensor Channels on my Go Direct Force Plate?) - Click or tap OK to set up the sensor.
Adjust the Settings
- Tap Mode to view the data-collection settings and make the following changes:
- Change the Rate to 10 samples per second.
- Change the Duration to 60 seconds.
- Tap OK to save the settings.
- Tap the Graph View tab,
 , to switch to the Graph screen.
 - Choose Graph Options from the Graph menu and make the following changes:
- Select the Manual scaling option.
- Change the X-Axis column to X-Axis Balance.
- For LabQuest 3: Change the Left value to -187.5 and the Right value to 187.5.
- For LabQuest 2: Change the Left value to -153 and the Right value to 153.
- Verify the Top value is 100 and the Bottom value is -100. Make changes if necessary.
- Make sure only the Y-axis Balance column is selected to show on Graph 1 Y-Axis.
- Uncheck Connect Points.
- Tap OK to save the changes.
Calibrate the Balance Channels
- Tap the Meter View tab,
 , to return to the Meter screen.
 - Have the test subject stand in the middle of the force plate. The test subject’s toes should be pointing towards the side of the Force Plate where the power button and USB port are located.
- Tap either the X-axis or Y-axis Balance meter, and select Calibrate. (Note: both channels are calibrated at the same time.)
- Remind the test subject to remain still while the sensor calibrates, then tap Calibrate Now and wait for the sensor calibration to complete (~10 seconds).
- Tap OK to complete the calibration.
Collect and Analyze Data
- Have the test subject stand on the Force Plate with their toes pointing towards the side of the Force Plate where the power button and USB port are located.
- Tap Collect,
 , and allow data collection to complete. The pattern on the graph will show the relative stability of the test subject as they stand on the force plate.
 - Choose Statistics from the Analyze menu and select Y-axis Balance. The standard deviation (std. dev) of the Y-axis Balance data can be used to quantify relative stability.
- Choose Integral from the Analyze menu and select Y-axis Balance. The integral value can also be used to quantify relative stability.
- Repeat steps 16−19 varying the conditions of the test (eyes closed, standing on one foot, etc.). Before each new trial, tap Store Run,
 , to store the data from the previous trial; otherwise, your previous data will be overwritten.
 - Repeat steps 11−20 for each test subject.
Tips for collecting good data.
- Make sure the test subject stands in the center of the force plate with their toes pointing towards the side of the Force Plate where the power button and USB port are located.
- Be sure to calibrate the Balance channels for each new test subject.
- To reduce the chance of injury from falling during data collection, be sure to assign one or more students to be a spotter for the test subject, especially when testing balance with eyes closed or standing on one foot.
How is the Balance Data Calculated?
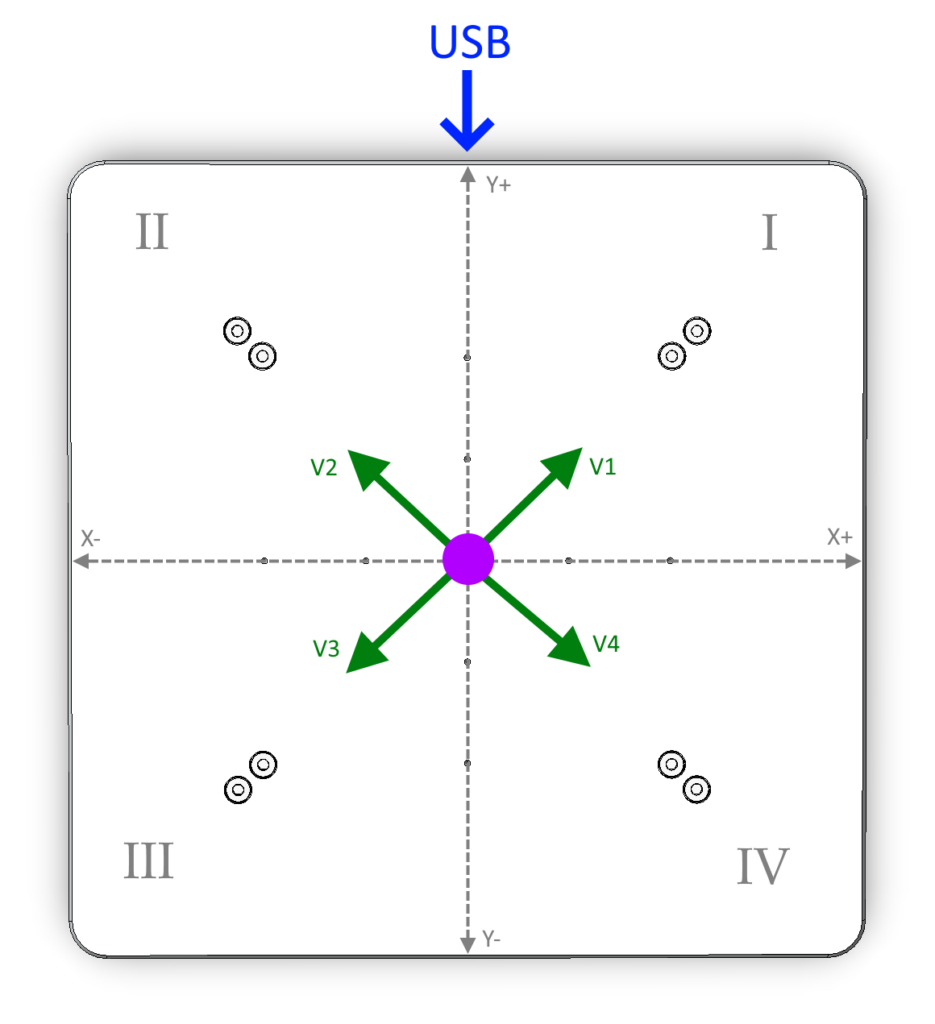
The surface of the force plate is modeled as a Cartesian coordinate plane as shown in the diagram. The X position balance and Y position balance values are calculated using the magnitude of the (scaled) force vectors V1, V2, V3, and V4.
The Balance values are calculated as follows:
- X-axis Balance = (V1 + V4) − (V2 + V3)
- Y-axis Balance = (V1 + V2) − (V3 + V4)
What does the Balance channel calibration do?
During calibration, about 10 seconds of Force sensor data are collected for each force vector (see above). The calibration performs two corrections using this data. First, it calculates an offset to align the test subject’s resting position to the origin. Second, it uses the total force reading to calculate a scale factor. The scale factor ensures the X-axis and Y-axis Balance values remain virtually mapped to the grid, even under maximum deflection in any direction.
For your convenience we have created a template file set up for this activity. Connect your Go Direct Force Plate, select the X-axis Balance and Y-axis Balance channels and then open this file:
Related Information
- Go Direct Force Plate Troubleshooting and FAQs
- How do I switch between Physics and Physiology Sensor Channels on my Go Direct Force Plate?
- What is the AUX port and Auxiliary Voltage sensor channel used for on a Go Direct Force Plate?
- Why does my X Balance seem less stable than my Y Balance when using the Go Direct Force Plate?