- Richard Born
- Northern Illinois University
- Operations Management and Information Systems
Introduction
The “Spectrum of Atomic Hydrogen,” Experiment 21 in Advanced Physics with Vernier–Beyond Mechanics, is a classical investigation of the Balmer Series of the hydrogen spectrum. In this experiment, students use the Vernier Emissions Spectrometer to determine the wavelengths of the visible lines of excited hydrogen gas, relate photon energies to energy level transitions, and determine a value for the Rydberg constant for hydrogen.
Vernier has a variety of additional spectrum tubes available including helium, nitrogen, neon, carbon dioxide, air and argon. These are typically studied qualitatively with students noting many more spectral lines, but with each spectrum having its unique characteristic lines. Students also generally observe that some lines are brighter than others and may classify their intensity as strong, medium or weak. In addition, students may also be asked to identify energy level transitions by consulting tables such as the online Atomic Spectra Database compiled by the National Institute of Standards and Technology (NIST).
But, would it be possible for students to perform a more quantitative analysis of atomic spectra beyond that of hydrogen? The addition of one more proton to the nucleus and one more orbiting electron, to make helium, results in a significantly more complex atomic system. Being the second simplest of atoms, helium could certainly be a starting point for a quantitative spectral analysis beyond atomic hydrogen.
Abramzon and Siegel have described a spreadsheet that allows students to perform an introductory analysis of the helium spectrum (American Journal of Physics 77 (10), October 2009, pp. 920–922). Their spectrum data was collected by the use of an Ocean Optics™ HR4000 High Resolution Spectrometer, with a price beginning at $4,850 (as of a 6-June-2013 online catalog). They indicate that for the experiment to be successful, an accuracy of ±0.5 nm is desirable. However, it has been found that a successful experiment can indeed be performed with the Vernier Emissions Spectrometer at about one-sixth the cost, even though its typical wavelength accuracy is given as ±2 nm. This fact opens up the excellent Abramzon-Siegel helium spectrum experiment for many more students to perform. Abramzon and Siegel also indicate that this experiment is ideal for college physics laboratories. Nevertheless, this experiment would be a great addition to students studying atomic physics at the high-school level, making this experiment available to an even larger audience.
What follows is a description of how the Abramzon-Siegel experiment was performed with the Vernier Emissions Spectrometer. Some changes by Born in the analysis are noted, and a discussion of some of the atomic physics concepts learned is included.
Data Collection
The Abramzon-Siegel experiment on the helium spectrum derives its value by comparing spectral lines from the hydrogen and helium spectra. Therefore, students need to collect data on the visible lines of hydrogen first or, if they have done Vernier’s Experiment 21, “Spectrum of Atomic Hydrogen,” they can use that data. We will assume that the student has used the Vernier Emissions Spectrometer and has obtained the following lines for the visible hydrogen spectrum: 656, 486, 434, and 410 nm.
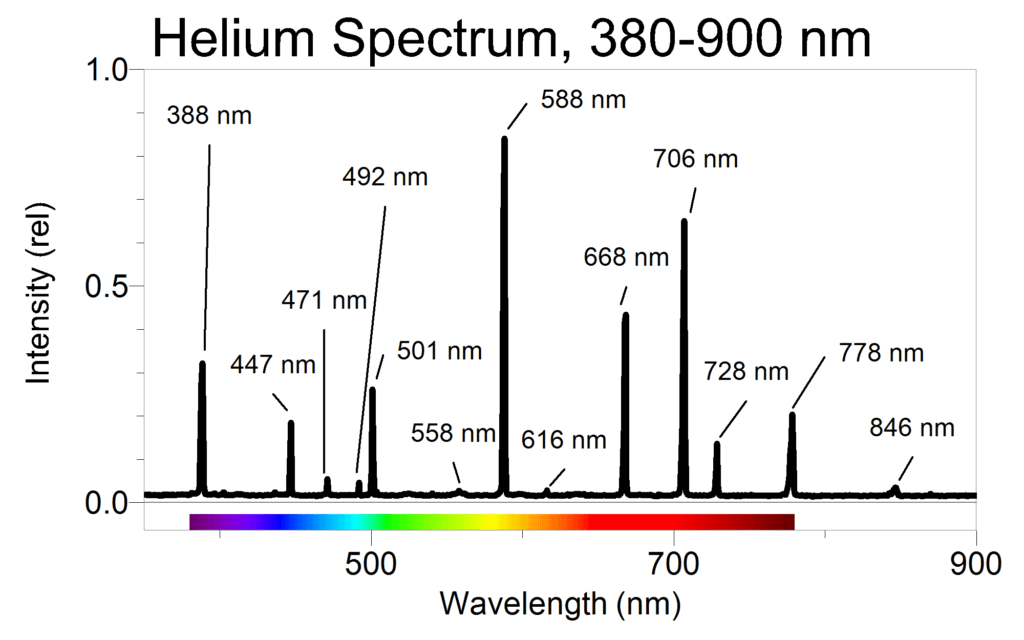
Students then use the Vernier Emissions Spectrometer to obtain the spectral lines of helium. Born used a sample time of 100 ms to obtain most of the more prominent lines between 380 and 900 nm. See Figure 1.
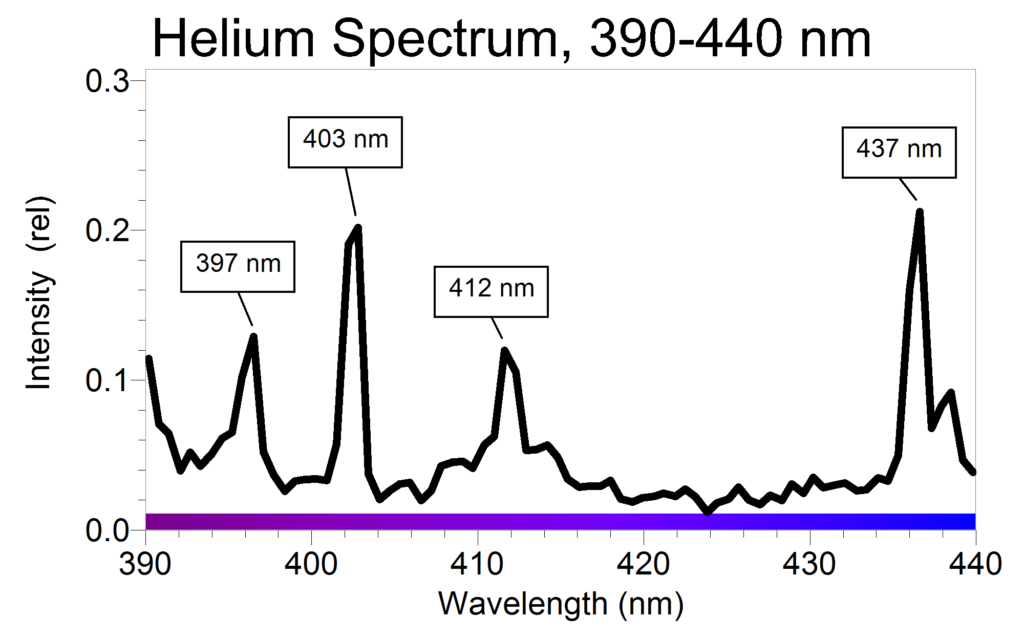
They should then hone in on the weak lines in the range of 390 to 440 nm by increasing the sample time to 900 ms. The results are shown in Figure 2.
The Helium Atomic Model
The model of the excited helium atom is approximated by having one of the electrons in the 1s level, the lowest energy level. This electron is called the screening electron, as it may partially screen out the nucleus. The remaining electron, the valence electron, is in an excited state. It emits a photon when it moves to a lower energy state.
The Spreadsheet
The spreadsheet that the student then constructs is the key analysis component of the Abramzon-Siegel experiment (see Figure 3). The hydrogen wavelengths are entered in a row near the top of the spreadsheet in order of the initial quantum number ni for their corresponding lines in the Balmer series. The helium wavelengths are entered in a column on the left side of the spreadsheet. Although Abramzon-Siegel suggest entering these in order of decreasing relative intensity, Born found it more instructive to enter these in order of decreasing wavelengths, as doing so would allow the student to more easily identify patterns in the spreadsheet data.
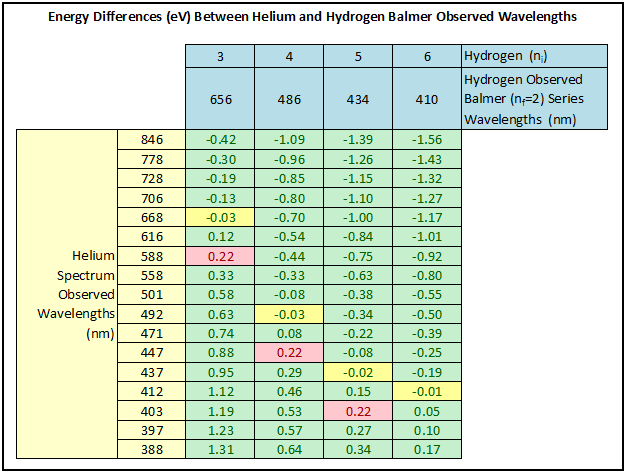
The values in the spreadsheet table are the energy differences in eV for every combination of helium and hydrogen photons:
This is readily derived from the well-known equations E=hf and c=fλ. The value of hc is 1.989 x 10⁻²⁵ joule-m, which converts to 1240 eV-nm since we are measuring energy in eV and wavelength in nm.
The spreadsheet energy differences can be computed by paying careful attention to relative versus absolute addressing in Excel®, or alternatively, by using the Data/What-If Analysis/Data Table feature of Excel. See the included Excel file for details.
Data Analysis
After completing the spreadsheet, the students are asked the following questions, which are somewhat more leading than Abramzon-Siegel’s suggestion that students try to “identify any patterns”:
- What happens to the energy differences as you scan from the top of any given column to the bottom of the column? [Most students quickly notice that the energy differences are increasing.]
- Why are the energy differences increasing as you scan down a given column? [Typical answer: The helium wavelength decreases as you go down a column, with smaller wavelength corresponding to higher energy photons.]
- What is the meaning of negative energy differences in the spreadsheet? [The hydrogen photon in the pair being compared had a higher energy, due to having a shorter wavelength than the corresponding helium photon.]
- Then comes the most important question: Do you see any energy differences that are the same or nearly the same for three or more columns? [Students will typically indicate the three-time occurrence of the value 0.22 eV, highlighted in pink in the spreadsheet, and the occurrence of the -0.03 eV and close -0.02 eV and -0.01 eV energy differences, highlighted in yellow in the spreadsheet.]
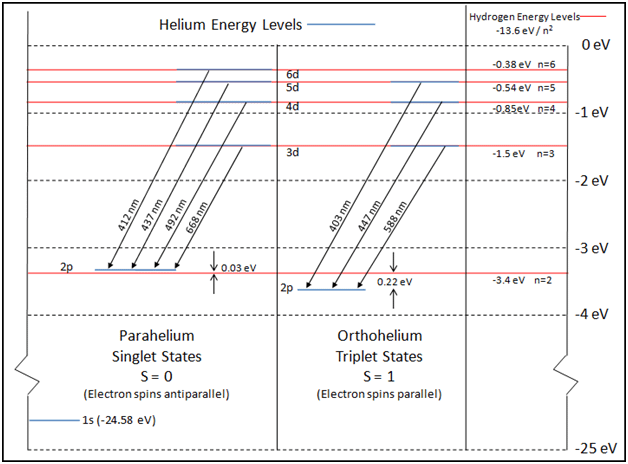
Discussion of these energy differences can then help the student understand some of the atomic physics of the helium atom. Figure 4, not provided by Abramson-Siegel, helps to make the discussion more visual. The 0.22 eV differences (observed for ni = 3, 4, and 5 for the hydrogen Balmer series) are consistent with the idea that the binding energy of the helium valence electron is identical to that of hydrogen, but with the nf = 2 level for helium shifted 0.22 eV down from the nf = 2 level for hydrogen. In a similar manner, the –0.03 eV (and close –0.02 eV and –0.01 eV) energy difference (observed for ni = 3, 4, 5, and 6) could be explained if the nf = 2 level for the helium valence electron is shifted up 0.03 eV from the nf = 2 level of hydrogen. Abramzon-Siegel point out further that for the orbital quantum sub-level d, the screening electron does a very good job of screening the nucleus. The valence electron essentially experiences the potential from only one of the helium protons. The net result is that the 2p level for the helium valence electron is split. One of the two split states is 0.22 eV lower than the respective hydrogen state, and the other split state is 0.03 eV higher than the hydrogen state.
Further Discussion
Causes for the splitting of the 2p valence electron levels in helium then offer the student some additional insight into atomic physics. With the screening electron in the ground state (1s), then there are two possibilities for the valence electron in the upper state. See Figure 5 to aid in visualization.
- The valence electron can have a spin antiparallel to that of the ground state electron. This state is often referred to as a singlet state, and is sometimes referred to as parahelium. In the singlet state, the spins of the two electrons, being antiparallel, are paired. Being paired, the electrons show no magnetic field and are diamagnetic.
- The valence electron can have a spin parallel to that of the ground state electron. This state is often referred to as a triplet state, and is sometimes referred to as orthohelium. In the triplet state, the spins of the two electrons, being parallel, are unpaired. Being unpaired, the electrons are repelled/attracted by magnetic fields, and are paramagnetic.
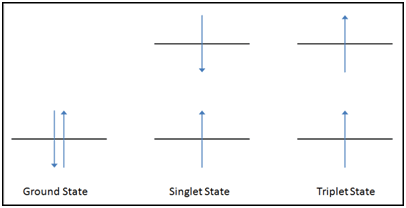
Students may wonder how the terms singlet and triplet arise. They actually come from the definition of multiplicity, where S is the total angular spin momentum
Multiplicity = 2S + 1
The total spin for a singlet state is zero since the electrons are paired. The multiplicity is then 2*0 + 1 = 1, thus the term singlet. The total spin for a triplet state is 1 since the electrons are unpaired. The multiplicity is then 2*1 + 1 = 3, thus the term triplet.
The singlet-triplet splitting of the 2p valence electrons of helium can be explained by a spin-spin interaction, which deals with the columb repulsion of the electrons. This is embodied in Hund’s First Rule—the term with the maximum multiplicity lies lowest in energy. Orthohelium, with a multiplicity of 3 has a lower energy than parahelium, with a multiplicitiy of 1.
Conclusions
In this quantitative investigation, the total singlet-triplet splitting of the 2p valence electrons of helium was seen to be 0.22 eV + 0.03 eV = 0.25 eV, as is shown in the energy level diagram displayed earlier. Consultation of the NIST Atomic Spectra Database reveals agreement of our value with published values. We have identified seven helium spectral lines:
- Triplets: 1s3d→1s2p, 1s4d→1s2p, and 1s5d→1s2p
- Singlets: 1s6d→1s2p, 1s5d→1s2p, 1s4d→1s2p, 1s3d→1s2p
The Abramzon-Siegel experiment offers students a great opportunity to conduct a quantitative study of atomic spectra concepts beyond those associated with the traditional Bohr model of the hydrogen atom.
Download A Quantitative Investigation of the Helium Spectrum experiment and spreadsheet »
