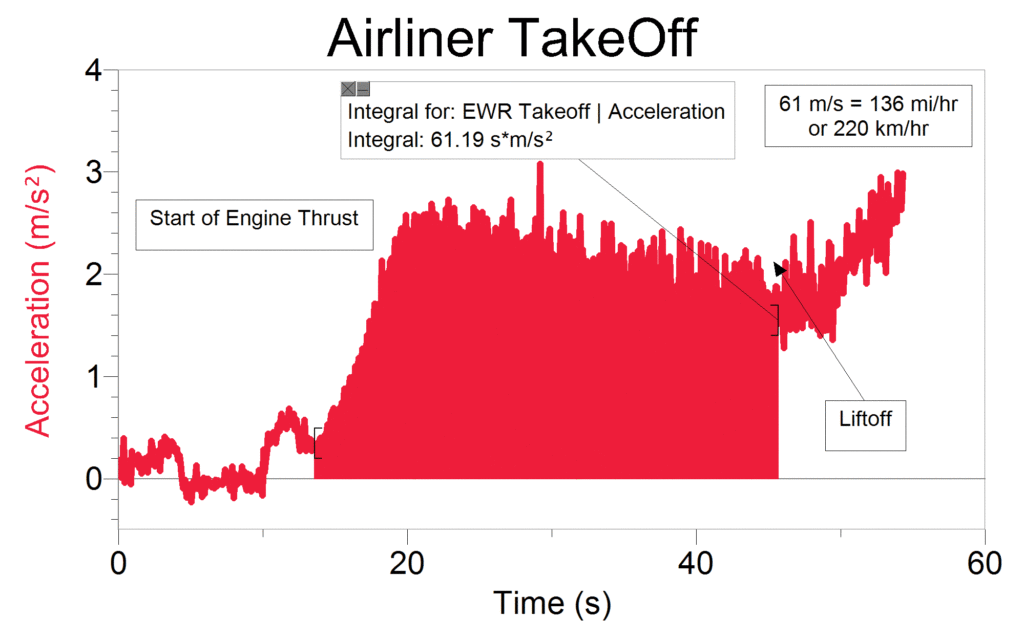
Recently the FAA and the airlines changed the rules to allow the use of tablets during takeoffs and landings. We could not resist getting acceleration data using the iPad’s built-in accelerometers and Graphical Analysis for iPad®, iPhone®, or iPod touch®.
Clarence Bakken, a long-time consultant for Vernier, recently collected data using Graphical Analysis on an iPad during a Boeing 737 takeoff. The iPad was leveled and held steady relative to the airplane throughout data collection. On the graph, the integral from the start of engine thrust through the time of liftoff was calculated. You can see the liftoff event on the graph where the acceleration appears to increase. This is really caused by the plane’s nose lifting up. The integral is about 61 m/s (136 mph), which is within the range of expected takeoff speeds for that aircraft. It might be interesting to ask students why the acceleration decreases during the trip down the runway.

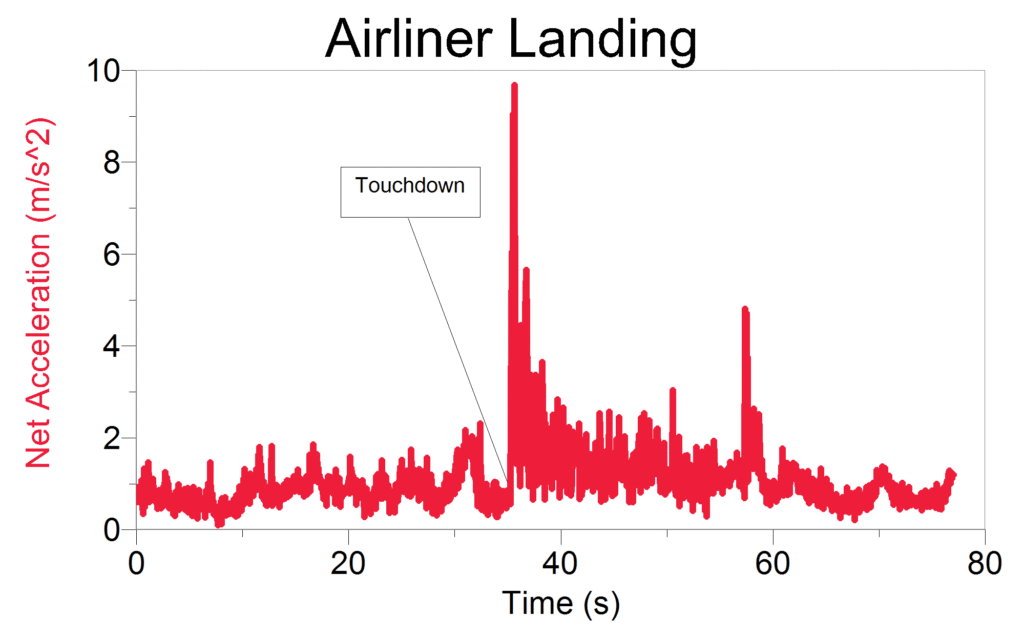
Here are the results of a landing. Note that the accelerometer readings while the plane is still flying are difficult to interpret, since the orientation of the plane changes somewhat on the final approach.

