Inspired to instruct students about renewable energy, professor Richard G. Born, from Northern Illinois University, developed a lab to investigate the relationship between hydroelectric power and the volume of water that moves a turbine in a given amount of time. Born connected a small water wheel and dynamo to a Vernier Circuit Board and added resistors. A Vernier Differential Voltage Probe and a Current Probe were used to collect voltage and current during the experiment.
The water from a faucet enters a turbine, spins the water wheel, and exits into a 2-liter bucket. The time required to fill the bucket was recorded for various faucet water pressures. After calculating and graphing the electric power for each of the water pressures and the volume of water moved per unit time, students could see that the amount of electric power produced is proportional to the cube of the volume of water moved per unit time.
Due to the current serious problems with a number of Japan’s nuclear reactors, caused by the March 11, 2011 magnitude-9.0 earthquake and resultant tsunami, interest is increasing on renewable energy that is environmentally friendly. One such source of electric power that has been around long before the advent of nuclear reactors is hydroelectric power produced by water falling from a given height in dams. On a much smaller scale, individuals can harness the power of moving water in streams or rivers by the use of small water wheels that draw power from the kinetic energy of the moving water without necessarily changing the height of the water.
The power of flowing water, derived from its kinetic energy, is given by the equation:
P = ½ρΦv², where
- ρ is the density of water
- Φ is the volume of water moved per unit time
- v is the speed of the water
If A is the area through which the water passes, then Φ = Av, and the equation for the power of the flowing water can be expressed alternatively as
P = ½ρΦ³/A²
Thus, one would expect that the electrical power generated from flowing water spinning a turbine should be proportional to the cube of the volume of water moved per unit time, Φ³. The purpose of this lab is to test this proportionality.
The key component of such an investigation is a small, school laboratory-sized turbine. A number of vendors of science equipment are now offering such a device, known as the Essential Physics Demo–Hydroelectric Demonstration, and selling for about $80. While this device was designed primarily for qualitative demonstrations to show how a water turbine can generate electricity to power a DC motor, incandescent light, or diode, it can also be used to perform quantitative experiments such as the experiment proposed in this lab.
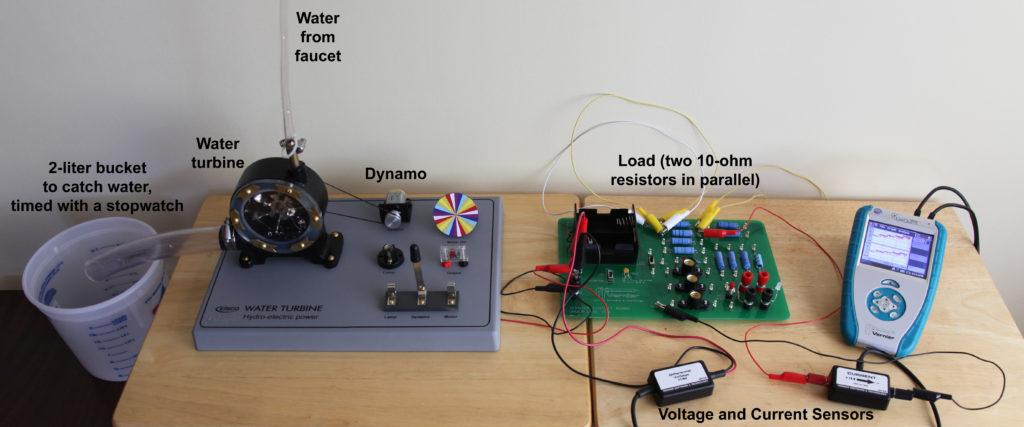
The basic set-up for the experiment is shown in the picture below.

Water from a faucet enters the water turbine at the top, spinning the water wheel, and leaves the turbine at the bottom filling a 2-liter bucket. The time required to fill the bucket is recorded for various faucet water pressures. Meanwhile, the electricity produced by the dynamo is connected to a load of two 10 ohm resistors (on the Vernier Circuit Board) in parallel, giving an effective resistance of 5 ohms. A Vernier Differential Voltage Probe and Current Probe are set to record the voltage and current at 0.5 second intervals for 20 minutes, which is more than sufficient time to collect all of the data.
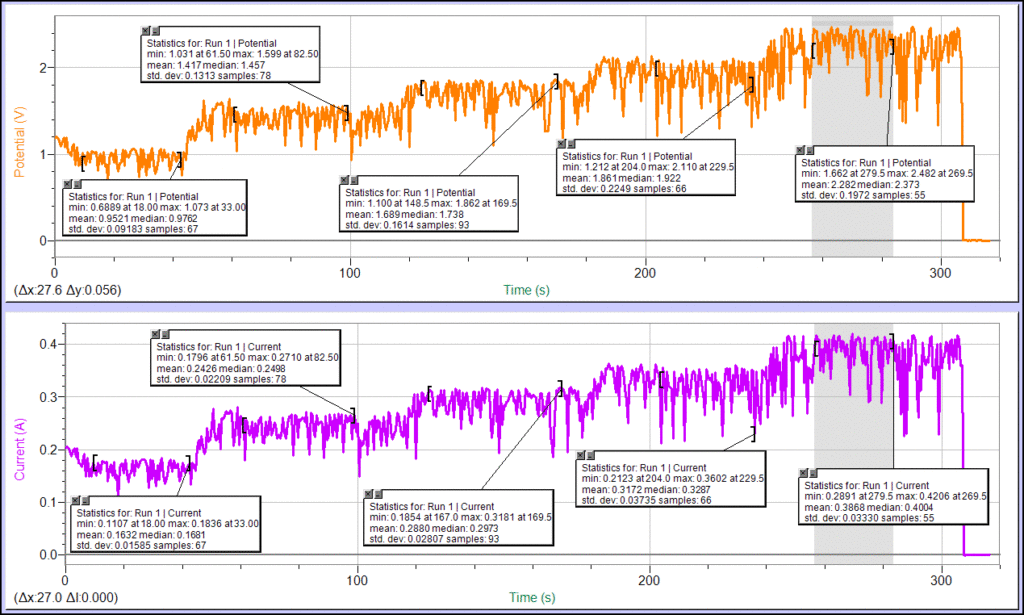
The figure below shows the Logger Pro file with voltage and current data collected for the duration of the experiment.

Five plateaus are seen for both voltage and the corresponding current. Each of the plateaus, as one scans from left to right, represent data as the water pressure is increased in the turbine, and measurements are concurrently made for the time required to fill the 2-liter bucket with water for each plateau. The Analyze/Statistics feature of Logger Pro is used to find the average voltage and current readings for each of the plateaus. Multiplying the average voltage and current readings gives the electric power (P = VI) for each of the five corresponding water pressures. The volume of water moved per unit time (Φ) is calculated by dividing the volume of the bucket (2 liters) by the stop-watch measured time to fill the bucket.
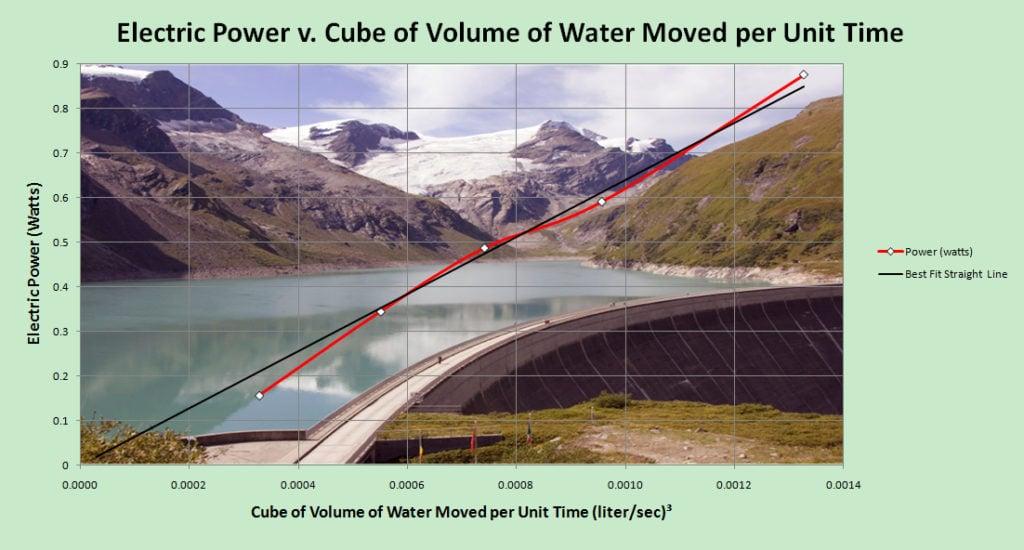
The Excel graph below shows the results as a plot of electric power in watts versus the cube of the volume of water moved per unit time in (liter/sec)³. The power, shown as a red line, closely follows the best fit straight line passing through the origin, where zero water volume would be expected to produce no electric power. It can be concluded that the electric power produced is proportional to the cube of the volume of water moved per unit time, in support of the theory predicted from the formulas presented earlier.

Comments:
- The leads from the dynamo on the underside of the Hydroelectric Demonstration apparatus are unscrewed from the apparatus and connected to the external terminals on the Vernier Circuit Board.
- The SPDT switch on the Hydroelectric Demonstration must be vertically straight up, not connected to the Lamp or Motor.
- The light bulb must be unscrewed from the Hydroelectric Demonstration. (As a side note, the light bulb supplied with the Hydroelectric Demonstration burns out very easily as water pressure is increased. It should be replaced by a Vernier #50 lamp [round body] when doing qualitative demonstrations with this device.)
- All hose connections on the Hydroelectric Demonstration should be tightened with #4 and #12 stainless steel clamps in place. The plastic clamps provided do not keep the hoses tight under medium to high water pressures from the faucet.
