- Richard Born, Associate Professor Emeritus
- Northern Illinois University
- Operations Management and Information Systems
Introduction
Nature has its way with air. Warm air rises (less dense), and cold air sinks (denser). This natural thermal stratification in buildings has its disadvantages. During the winter, it causes heating systems to produce more heat than is necessary for comfort by continuously replacing heat that rises away from floors to ceiling spaces that are not occupied.
Thermal destratification fans, such as paddle fans, box fans, and the more modern and energy efficient axial turbine fans, are commonly used to even out the temperature from floor to ceiling. This results in keeping the thermostat more satisfied, without the heating system overproducing heat and without wasting energy. Reduced energy also means a reduction in carbon emissions to the environment as well as reduced energy costs for home and business owners.
In this investigation, students will make use of the FLIR ONE™ Thermal Camera for iOS, available from Vernier, and the free Vernier Thermal Analysis app to study thermal stratification and destratification of air in a room. In the next two sections of this paper, a suggested procedure and analysis of data are presented.
Procedure
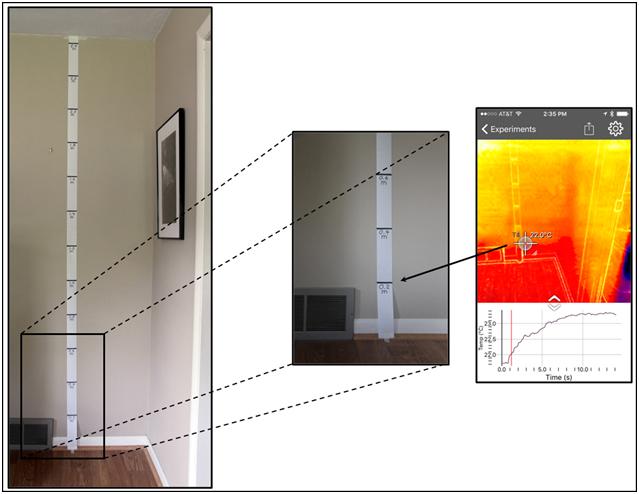
See Figure 1 to see the author’s setup for this investigation. The picture on the far left shows a piece of adding machine tape that has been taped to an inside wall. The tape is marked in increments of 0.2 m from the floor to close to the ceiling (0 to 2.4 m). The picture in the middle of Figure 1 shows an enlarged portion so that the markings on the tape can be seen well. The iPhone screen image on the far right of Figure 1 shows that one thermometer was placed near the center of the screen and set to read temperature at a point, not a region. With the camera aimed at the bottom of the tape, tap the Record button to start recording the video. The camera is gradually tilted upward for about 15 seconds with the thermometer following the adding machine tape upward. When the thermometer reaches the ceiling level, tap the Start button again to stop recording the video. A copy of the resulting video, thermal-stratification.mov, is included in the experiment download below. Manually studying this video frame by frame, values for height above floor level and corresponding temperature are recorded into a Logger Pro .cmbl file.
The above procedure is repeated to obtain a second video after running a paddle ceiling fan in the room for about 15 minutes. The fan acts as a destratification device, and height and temperatures are again recorded into the Logger Pro file. A copy of the Logger Pro file, Stratification Experiment.cmbl, is included as one of the downloads below.

Data Analysis
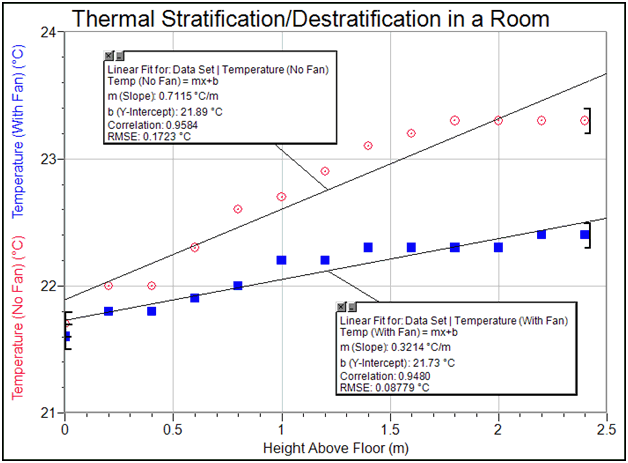
Figure 2 contains a Logger Pro graph of temperature vs. height above the floor. The red data points were obtained for stratification (no fan) while the blue data points were obtained for destratification (with a ceiling paddle fan). A Linear Fit is applied to each of these two scenarios, with correlations of about 0.95. The slopes clearly show the effect that destratification has on the temperature difference from floor to ceiling. Without the fan, the temperature gradient is about 0.7°C/m, or about two degrees from floor to ceiling. With the fan, the temperature gradient is reduced to 0.3°C/m, less than half the temperature gradient without the fan. Destratification appears to be an effective means for evening out the temperature and thus promoting the advantages indicated in the introduction.
It can also be noted from the graph that the temperature is much more constant with a fan in the region from 1 m to 1.5 m, where human activity is most prevalent. Finally, it is seen that the temperature with a fan is slightly lower than without a fan at all levels above the floor. This can be due to a number of factors, one of which is that the heating system was not on during the course of the entire experiment. The experiment was performed during the month of May in Illinois with an outside temperature of about 60°F on a partly sunny day.

Extensions
- These temperature measurements were taken on an inside wall. Are the results significantly different if they are taken on an outside wall?
- These temperature measurements were taken during a normal Northern Hemisphere spring day in May. Are the results significantly different if taken on a hot summer day in July?
- If you have access to a room with high ceilings such as a gymnasium or theater, investigate stratification in these rooms. What is the temperature difference from floor to ceiling? What if the room is filled with an audience of people?
Downloads
Download the Logger Pro experiment file and video for this experiment »
