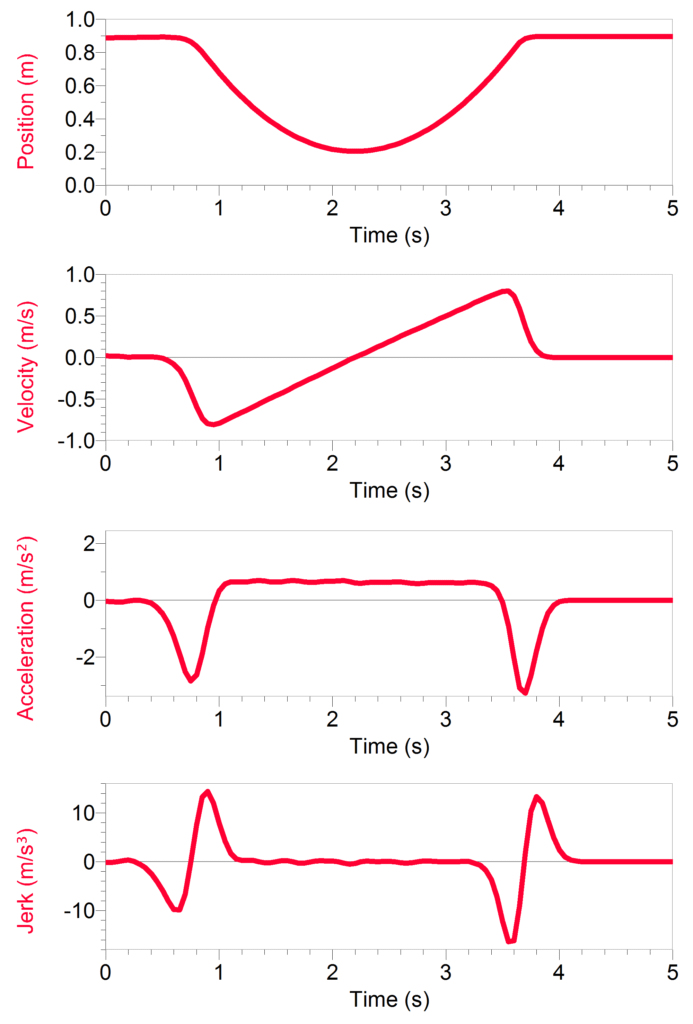
With the Vernier Motion Encoder System, the position, velocity, and even the acceleration graph looks great. Just for fun, we created a graph of the time derivative of acceleration, commonly called jerk. If you think about what it feels like in a car when the acceleration suddenly changes (the time derivative of acceleration is non-zero, in physics-speak) you’ll know that this quantity is well named.
Creating a useful graph of jerk requires that the underlying position data are very clean, as any bit of noise will be magnified by the successive derivatives.
Here’s the family of graphs for a cart rolling up and down an inclined track. With sufficiently low friction, the acceleration should be nonzero and constant while the cart is freely rolling. The jerk should then be close to zero in the same time interval. As you can see, the graph of jerk is close to zero throughout the rolling time, but it is non-zero when the cart is launched and caught. Data from a conventional motion detector wouldn’t look nearly this clean.

