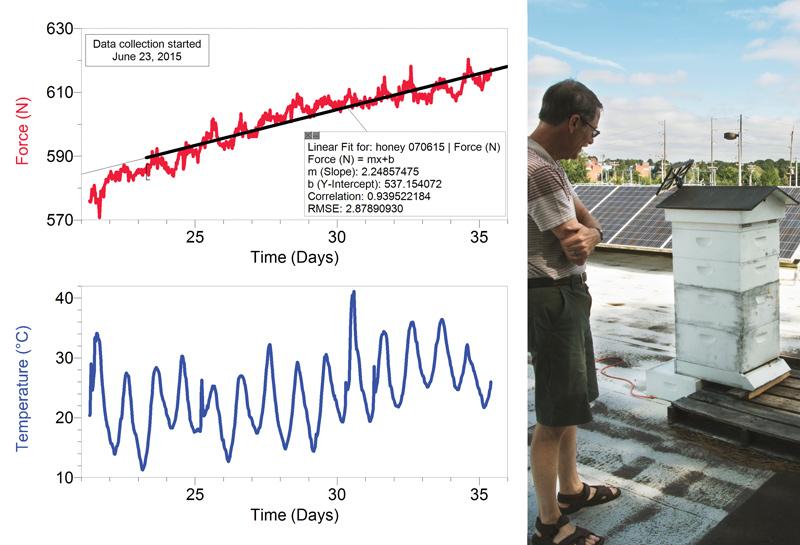
We often find ways to use our sensors in unusual ways around our building. One of our Technical Support/R&D specialists is a beekeeper, and a couple of years ago he talked us into placing a bee hive on our roof. Vernier employees enjoy learning about the bees and monitoring the hive with our data-collection equipment. This year, we placed the hive on a platform with about half of its weight supported by our Force Plate. This lets us track a rough measurement of the weight of the hive.

In the force and temperature graphs, you can see data collected during a very warm, sunny period in June and July of this year. Note the daily variations in the force graph. We think these are caused by a number of things, including the bees going in and out of the hive and slight changes in the Force Plate’s calibration caused by temperature variations. The Force Plate was designed to be used in a room-temperature lab. Overwhelming the daily force variation is a gradual increase in force. Based on the curve fit data and assuming half of the weight of the hive is on the Force Plate, we think that during the data-collection period, the hive gained about 0.5 kg (1 lb) per day, which we attribute to the pollen brought in by the bees and honey production.
