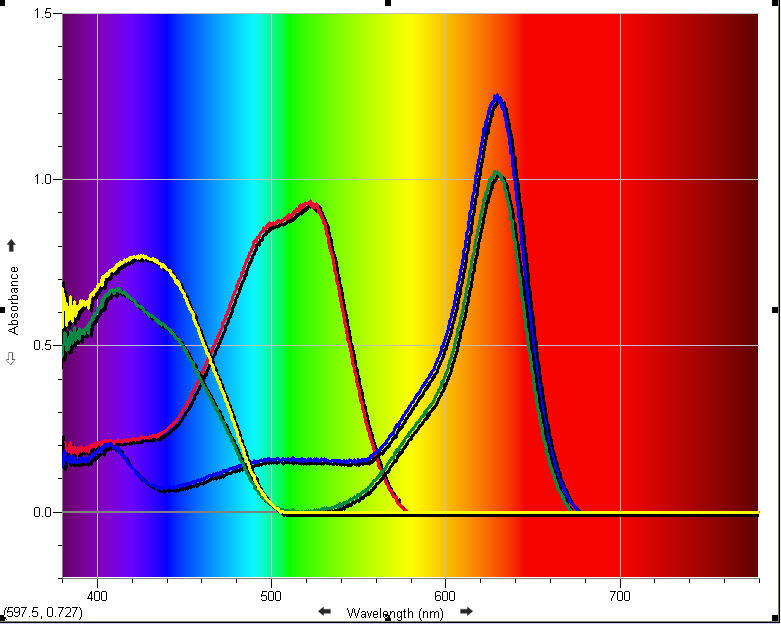
Creating the absorption spectrum of an aqueous sample is easy and fast with the Vernier Spectrometer. The graph below represents the spectral analysis of the four common food dyes. (The color of the line represents the color of the dye.) Students are often surprised to see that yellow dye peaks in the blue wavelengths and red dye peaks in green wavelengths.
This activity is a great way to introduce spectral analysis, as it helps students understand the relationship between the color of the solution and the ideal wavelength they should use to measure variations in absorption. Be sure to download the activity and give it a try.
Download activity Visible Spectra of Commercial Dyes (171 KB PDF)