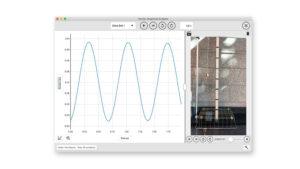
Making the switch from Logger Pro? This video provides a quick tour of five advanced features in Vernier Graphical Analysis® Pro that will be familiar to Logger Pro users and valuable for creating an efficient, student-friendly approach to collecting, analyzing, and visualizing data in physics, chemistry, and biology labs.
This video covers
- Custom Calculated Columns
- Manual Curve Fit
- Data Strikethrough
- Error Bars
- Uncertainty of Curve Fit Parameters
We’ll walk you through where to find these tools and how to use them in Graphical Analysis Pro, making it easy to get started. These features are just part of what the Pro version unlocks, in addition to live data-sharing, FFTs, and a library of over 45 ready-to-analyze investigations. Let’s get started!