Sharing ideas and inspiration for engagement, inclusion, and excellence in STEM
How can physics principles help us better understand biological phenomena? Sound provides a perfect opportunity to bridge these disciplines. By analyzing biological sound patterns—such as whale songs, bird calls, or bat echolocation—students can explore the physics of waves while gaining insights into animal communication and behavior.
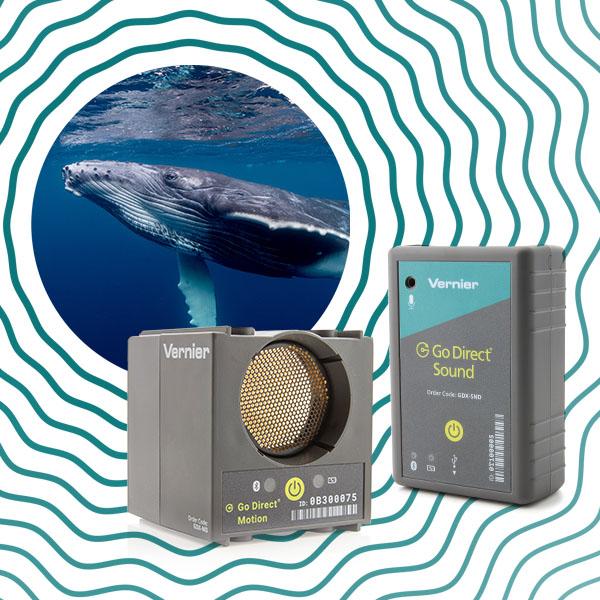
In physics, sound is typically studied in units on waves and vibrations, where students examine properties like frequency, amplitude, and wave interference. These same principles also play a role in biology, where sound is crucial for animal behavior, communication, and survival. Using tools like the Go Direct® Sound Sensor and Go Direct Motion Detector, educators can help students connect wave properties to real-world biological systems and take a cross-cutting approach that emphasizes structure and function in both subjects.
The Physics of Sound
We consider sound to be vibrations within a physical medium at a frequency that human ears can detect, between 20 Hz and 20,000 Hz. Vibrations slower than 20 Hz are considered to be infrasound, and vibrations over 20,000 Hz are considered ultrasound. The physical medium is usually air, but can be liquids and solids, as well. In outer space, where there is no air, there is no sound. As they say, in space, nobody can hear you scream.
The vibrations consist of pressure waves that travel outward from the source—and our ears detect and interpret them. Different materials and sources can generate sound waves with unique characteristics—whether it’s our vocal cords vibrating, strings on a musical instrument, or the tines of a tuning fork.
When students first start thinking about the properties of sound, they often focus on how loud it is (amplitude or intensity) and its pitch (frequency). An easy way to visualize and analyze these properties is with the Go Direct Sound Sensor and Vernier Graphical Analysis® Pro.
Waveform and FFT Analysis
The Go Direct Sound Sensor uses a MEMS microphone to capture high-resolution sound data (up to 10,000 samples per second) that covers most of the range of human hearing. Students can use it to capture sound data and investigate wave amplitude, frequency, and harmonics.

With Graphical Analysis Pro, students can use Fast Fourier Transform (FFT) analysis. A waveform graph shows how sound pressure changes over time. An FFT dissects that waveform into its component frequencies and their relative amplitudes. This feature is particularly valuable for better understanding resonance and harmonics. Why do instruments, like a cello and a French horn, sound different even when playing the same note? The FFT helps identify the unique frequency signatures that create different timbres.

Physics Investigations with the Go Direct Sound Sensor
Students can explore key wave properties through hands-on investigations using the Go Direct Sound Sensor with classroom-tested experiments from Physics with Vernier and Physics Explorations and Projects.
- Observe how wave patterns change with frequency and amplitude.
- Compare the waveforms of various musical instruments.
- Measure the speed of sound using reflected sound waves in a tube.
- Explore beat patterns and sound interference.
- Analyze the logarithmic nature of the decibel scale.
- Investigate how different materials absorb or reflect sound.
The Biology of Sound
Now that we’ve explored the physics behind sound waves, let’s look at the same idea through a biological lens. Animals, including humans, rely on sound for survival, whether it’s for communication, navigation, or detecting predators. Animal vocalizations vary in frequency, amplitude, and harmonic structure, and have been shaped by evolution to adapt to ecological needs. The same physics principles that explain the sounds produced by a tuning fork or a violin string can also help explain why different species produce and interpret sound the way they do.
How and Why Animals Make Sounds
Animals produce sound using specialized structures, from vocal cords to vibrating body parts, and they do so for a variety of purposes.
Establishing territory: Many birds—particularly males—use songs to define their space and warn others to stay away.
Attracting a mate: In species such as frogs and whales, vocalizations play a key role in courtship.
Communicating warnings or distress: Prairie dogs, for example, use distinct calls to warn others of specific predators.
Social expression: Elephants use infrasound to maintain social bonds across long distances.
Navigation and hunting: Bats, dolphins, and some birds use echolocation to locate prey and navigate in the dark.
Tips for Analyzing Animal Sounds with the Go Direct Sound Sensor
The Go Direct Sound Sensor is great for collecting live sound recordings in real time, but it can also be used to analyze pre-recorded sounds! When live samples aren’t practical—like getting a humpback whale into the classroom—sound recordings are the next best thing. Here are some best practices for this approach.
Animal calls are variable: Keep in mind that unlike a tuning fork, animal sounds are often complex and change over time.
Use short analysis periods: Capture just a few seconds of sound to ensure cleaner data and reduced processing time. Download this Graphical Analysis template before collecting animal sound data to use our recommended settings.
Find high-quality, isolated recordings: Background noise from wind, boat motors, or other animals in recordings can interfere with the quality of sound waveforms. Try to find crisp, clear recordings and minimize room noise when you collect the sound with the sensor for best results.
Start with simple sounds first: We recommend adapting or building on Experiment #34 from Physics with Vernier (Tones, Vowels, and Telephones) to incorporate animal sounds as a more complex data set. Use the Go Direct Sound Sensor to:
- Analyze and compare sound waveforms from different species.
- Use FFT analysis to examine harmonic structures and frequency distribution.
- Discuss how environmental factors, such as water versus air, influence sound propagation.
- Ask questions related to evolutionary adaptation and the structure and function of animal sounds.


Use the Go Direct Motion Detector to Teach
Animal Echolocation
Echolocation is a biological adaptation used by bats, dolphins, and some people with visual impairment to navigate and locate objects. The Go Direct Motion Detector operates on similar principles: It emits ultrasound pulses and measures the time delay of returning echoes.
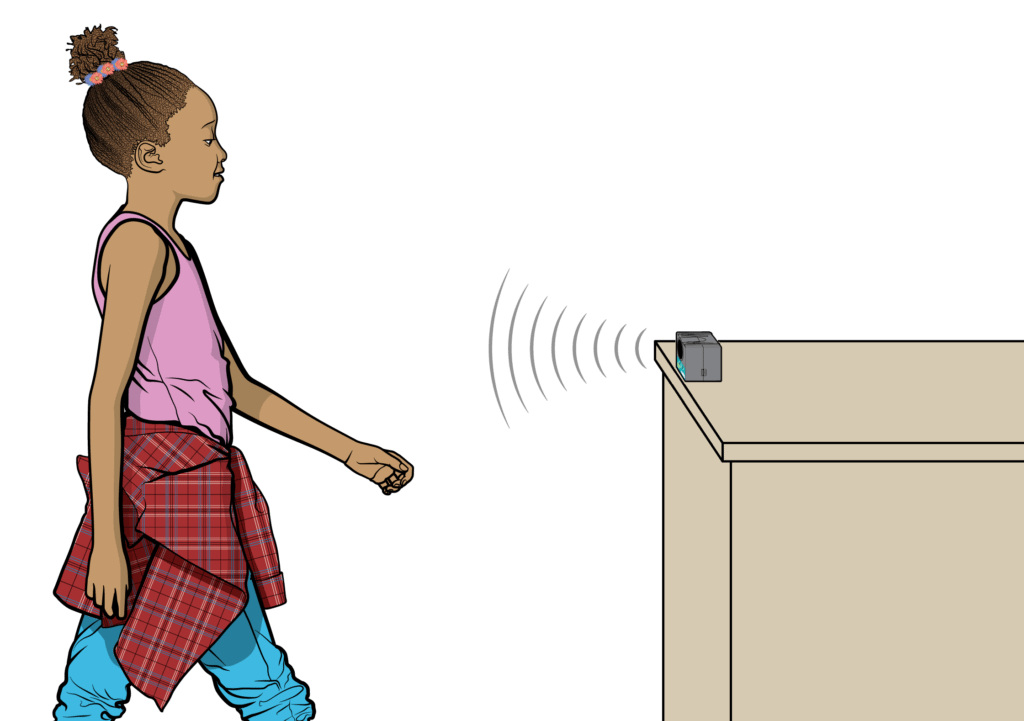
Students can experiment with detecting objects of different sizes and materials, gaining insight into how animals interpret sound reflections to ‘see’ in complete darkness. Start with Graph Matching as an introductory activity.
Additional Resources
Watch our recent webinar, Animal Acoustics: Analyzing Sound Waves in Physics and Biology, to see Vernier physics and biology experts demonstrate these ideas in real time.
For educators looking to explore these concepts further, here are some great resources to check out.
- Discovery of Sound in the Sea: A collection of marine animal sounds and research on ocean noise pollution
- Macaulay Library (Cornell Lab of Ornithology): A comprehensive archive of bird and animal calls
- Merlin Bird ID (Cornell Lab of Ornithology): A tool for identifying bird species by their songs
- National Park Service Bat Research: Information on bat echolocation and conservation
- Human Echolocation (World Science Festival): A short video on individuals who have trained themselves to use echolocation for navigation
Have you tried an interdisciplinary approach to teaching physics and biology? Let us know what you’ve tried and share with us on social! Questions? Reach out to support@vernier.com, call 888‑837‑6437, or drop us a line in the live chat.
Share this Article
Related Articles


Sign up for our newsletter
Stay in the loop! Beyond Measure delivers monthly updates on the latest news, ideas, and STEM resources from Vernier.