Sharing ideas and inspiration for engagement, inclusion, and excellence in STEM
Covering more than 70% of Earth’s surface, the ocean plays a vital role in our planet’s climate, ecosystems, and everyday life. World Ocean Day (June 8) and World Ocean Month offer timely opportunities to explore this dynamic system through interdisciplinary learning that connects chemistry, biology, Earth science.
From simulating sonar mapping to measuring water quality factors like salinity or dissolved oxygen, investigating real-world ocean phenomena creates a natural gateway into 3D learning. Here are three ready-to-use experiments designed to help middle and high school students ask questions, collect data, and make sense of the science beneath the surface—this month and all year long.
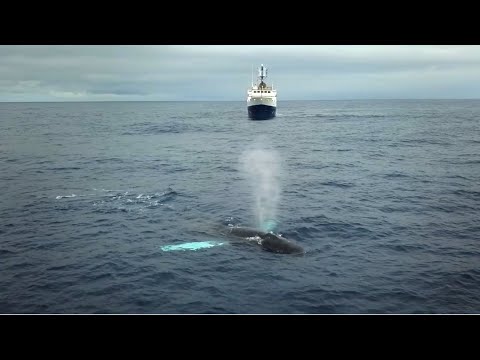
Introduce your students to the big picture of ocean science. In this short video from the Schmidt Ocean Institute, published by NOAA, students can see how scientists use sensors and data to explore the deep ocean and better understand its role in Earth’s systems.
1. Mapping the Ocean Floor
Experiment #19 from Earth Science with Vernier
Subject: Physics, Earth Science, Physical Science
Grades: Middle school and high school
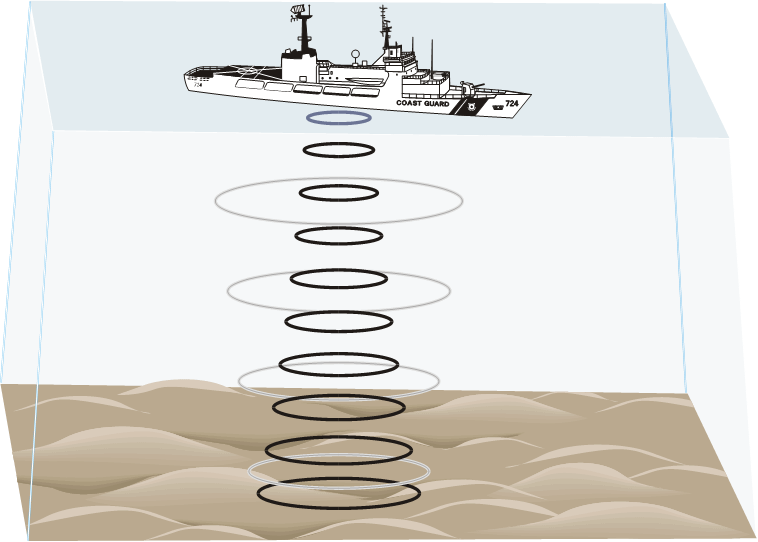
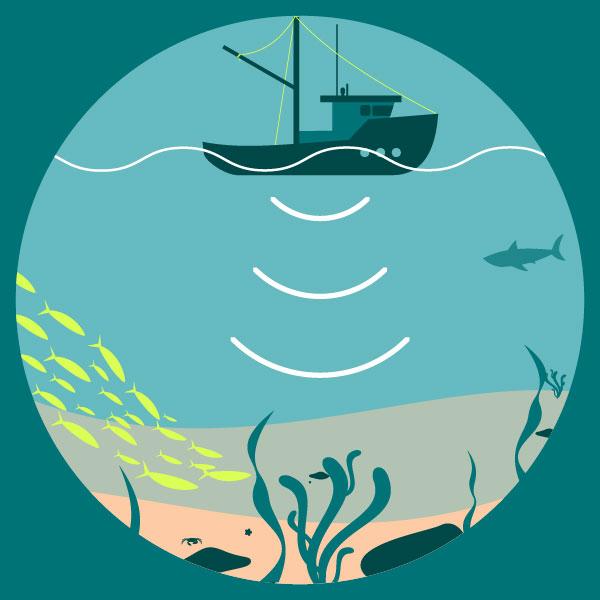
How do scientists map the seafloor when they can’t see it? Since the early 20th century, oceanographers have used sonar—short for sound navigation and ranging—to explore the depths. First developed during World War I to detect submarines, sonar remains one of the primary tools for investigating the deep ocean, from tracking underwater topography to locating shipwrecks.
This technology relies on echo sounding: sending sound waves into the water and measuring how long they take to bounce back. The longer the return time, the deeper the object. By collecting sound data across a grid, scientists can generate detailed maps of the ocean floor.

In this hands-on investigation, students simulate sonar mapping using the Go Direct® Motion Detector. They model the process of echo sounding, calculate distances based on time and wave speed, and create a map of a simulated seafloor. It’s a tangible way to explore wave behavior, scientific modeling, and marine science tools—all from the classroom.
Objectives
- Use a motion detector to measure distances.
- Simulate sonar to map a model seafloor.
- Analyze and interpret data.
2. Salinity of Ocean Water
Experiment #15 from Earth Science with Vernier
Subject: Chemistry, Environmental Science, Earth Science
Grades: Middle school and high school
Why can’t we drink ocean water? The answer lies in its salinity—the concentration of dissolved salts that gives seawater its unique chemical properties. Salinity is influenced by both ancient geologic and hydrologic processes, like the weathering of rocks, as well as modern dynamics, such as evaporation, precipitation, and freshwater inflow.
Today, average ocean salinity is around 35 parts per thousand, but it varies regionally—it can be lower at the ocean’s surface where rain, snow, and melting ice dilute the salinity levels. And, it can be higher in polar and hot arid regions. For example, the Dead Sea’s extreme salinity, which is nearly seven times that of typical ocean water, provides a compelling case study about how environmental factors influence salinity.
By investigating salinity, students can make scientific connections to broader topics such as climate change, the ocean’s circulation, water cycles, and more.
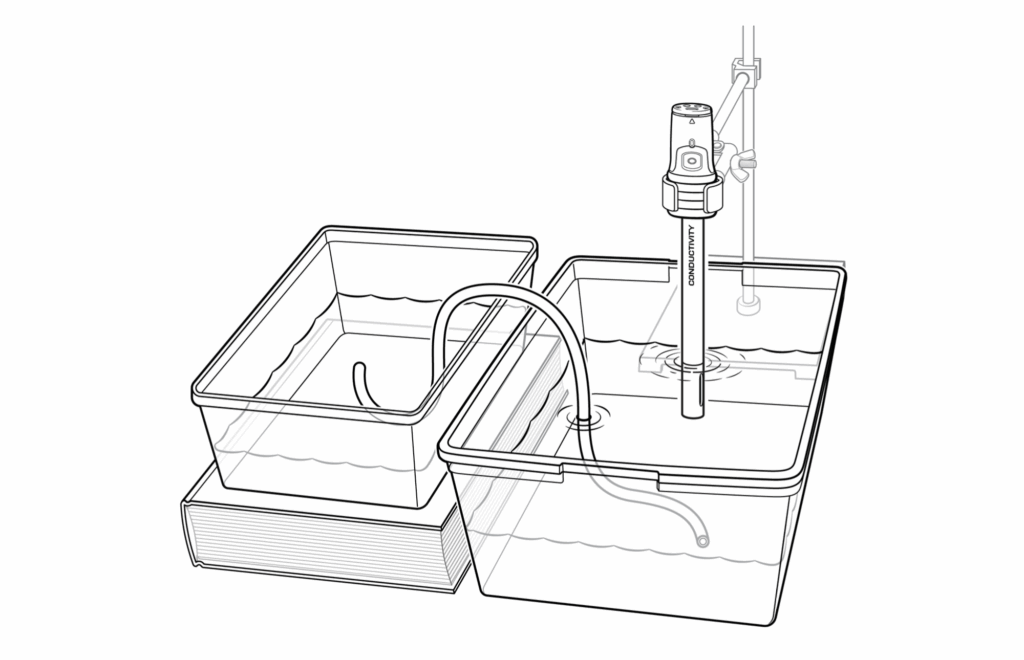
In this investigation, students use the Go Direct Conductivity Probe to measure the salinity of saltwater. Students conduct two hands-on simulations: one shows how evaporation increases salinity, and another models how river water lowers salinity where it enters the ocean. Along the way, you can connect this experiment to broader topics like ocean circulation, climate change, and the water cycle.
Objectives
- Measure the salinity of a water sample using a conductivity probe or a salinity sensor.
- Determine the effect of evaporation on the salinity of ocean water.
- Determine the salinity change when a river flows into an ocean.
- Analyze and interpret data to model environmental processes.
3. Investigating Dissolved Oxygen
Experiment #16 from Investigating Biology through Inquiry
Subject: Biology, Environmental Science
Grades: High school and college
Dissolved oxygen (DO) is a key indicator of water quality and an essential concept for students exploring ocean science. In marine environments, oxygen enters the water through air-sea interactions, by photosynthesis, and via the rapid movement of waves and currents. These processes vary depending on location, temperature, and ocean dynamics, making DO a powerful indicator of an ocean’s health.
In this student-led investigation, students use the Go Direct Optical Dissolved Oxygen Probe to measure DO levels in different water samples or to simulate ocean conditions. This can provide students with insight into how marine organisms survive, how human activity affects ocean ecosystems, and how climate-driven changes—such as warming ocean temperatures—impact oxygen availability.
Students are encouraged to design their own experiments—posing questions, testing variables, and building models that reflect real-world processes. This approach is a flexible, inquiry-driven way to explore life science concepts through the lens of ocean systems.
Objectives
- Determine the DO level of a water sample using a dissolved oxygen probe.
- Use reference sources to find out more about dissolved oxygen issues in the environment.
- Investigate a researchable question dealing with dissolved oxygen.
- Plan and carry out investigations to model biological systems.
- Analyze and interpret data.
Looking for More Ocean Science Ideas?
Want even more ways to engage students in hands-on exploration? These additional resources and investigations will help teach students about other facets of the ocean as they learn important scientific concepts and can be adapted to teach concepts from middle school through college.
- Making Waves: Ocean Science Investigations with Vernier: In this on-demand webinar, Vernier biology experts Colleen McDaniel and Dr. Sara Tallarovic share strategies for bringing ocean phenomena into your classroom using popular Go Direct sensors. From lesson planning tips to data collection techniques, this webinar is packed with actionable ideas.
- Ocean Acidification through pH: Explore how increasing carbon dioxide levels affect ocean chemistry and marine ecosystems with the Go Direct pH Sensor.
- Dissolved Oxygen in Water: Investigate how factors like temperature and water movement influence oxygen availability for aquatic life with the Go Direct Optical Dissolved Oxygen Probe.
- Sea Floor Spreading: Use the Go Direct 3-Axis Magnetic Field Sensor to model how Earth’s magnetic reversals and tectonic activity create new ocean crust.
- Animal Acoustics: Analyze waveforms of animal sounds—like whale songs—using the Go Direct Sound Sensor to study how ocean animals communicate and navigate.
Have you tried an interdisciplinary approach to teaching about the ocean? Let us know what you’ve done and share with us on social! Questions? Reach out to support@vernier.com, call 888-837-6437, or drop us a line in the live chat.
Share this Article
Related Articles


Sign up for our newsletter
Stay in the loop! Beyond Measure delivers monthly updates on the latest news, ideas, and STEM resources from Vernier.