Sharing ideas and inspiration for engagement, inclusion, and excellence in STEM
If you’ve taught equilibrium in AP Chemistry or college general chemistry, you know the classic setup: add an acid to an indicator, watch it change color, add a base, watch it change back. This setup illustrates Le Chatelier’s principle just fine—but it stops short of where the real chemistry happens. What if students could actually calculate the equilibrium constant from that color change?
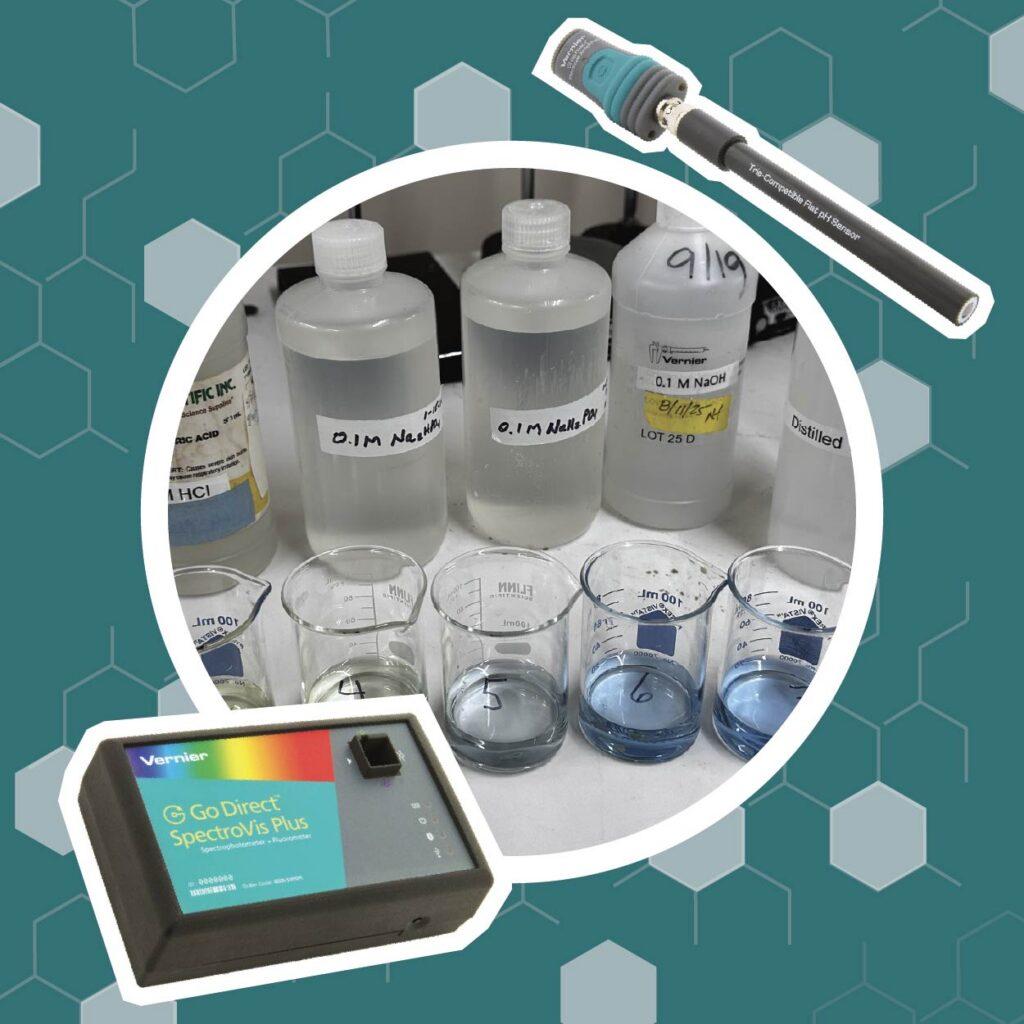
That’s exactly what this experiment does. Using bromothymol blue (BTB), a Go Direct® pH Sensor, and a Go Direct SpectroVis® Plus Spectrophotometer, students measure the concentrations of both forms of the indicator at equilibrium and use Beer’s law to determine a real value for Keq.
The result is a more quantitatively rigorous experiment—and a safer, greener one.
Why BTB? A Greener Alternative to Iron Thiocyanate
If you’ve done the classic iron(III) thiocyanate equilibrium lab, you know the drill: iron nitrate, nitric acid, hazardous SDS forms, and chemicals you really shouldn’t pour down the drain. It works, but the safety and disposal concerns are real.
Bromothymol blue solves that problem. The indicator itself and the sodium hydrogen phosphate solutions used to shift the equilibrium are non-hazardous—safe to handle and safe to dispose of down the drain with water. The only chemicals requiring extra care are the 0.1 M HCl and NaOH used in the Beer’s law portion, and at those concentrations, they’re mild.
Beyond safer chemicals, this experiment embodies several other green chemistry principles:
- Water as the primary solvent
- Room-temperature reactions
- Small sample volumes
- Real-time data collection that minimizes reagent use
Students even reflect on this directly in the post‑lab, which makes the green chemistry angle a genuine learning outcome, not just a footnote.
The Chemistry Behind the Experiment
Bromothymol blue is a weak acid indicator that exists in two forms depending on pH:
HIn + H2O ⇄ In– + H3O+
- HIn is the molecular (acidic) form—yellow, with peak absorbance around 428 nm
- In⁻ is the ionic (basic) form—blue, with peak absorbance around 612 nm
- In the middle (roughly pH 6–7), the solution appears green, because both forms are present in significant concentrations
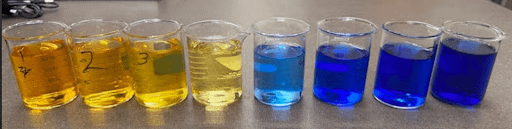
That green zone is where the magic happens. When both components contribute meaningfully to absorbance, you can measure each one independently using spectrophotometry—and that’s what makes calculating Keq possible.
This is the equilibrium expression students are solving for:
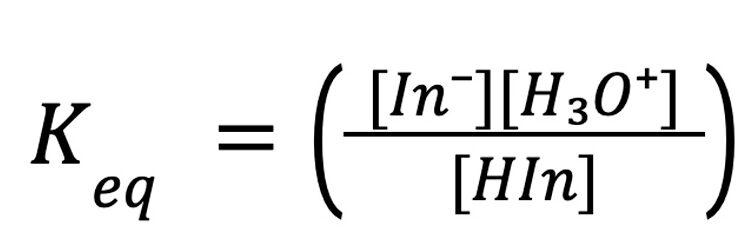
To find it, students need three values:
- The concentration of In⁻ and HIn, determined from Beer’s law plots
- The hydronium ion concentration, calculated from pH
Experiment Setup
What You’ll Need
- Go Direct SpectroVis Plus Spectrophotometer
- Go Direct pH Sensor
- Vernier Spectral Analysis®
- Vernier Graphical Analysis® Pro
- Chromebook™, computer, or mobile device
- Plastic cuvettes and standard lab glassware
- 0.04% bromothymol blue indicator solution
- 0.1 M HCl and 0.1 M NaOH
- 0.1 M Na2HPO4 and 0.1 M NaH2PO4
A note on BTB: Stock BTB typically comes as a 0.04% solution. One of the pre‑lab tasks is converting that to molarity—a good reminder that percent concentration and molar concentration aren’t the same thing.
A note on distilled water: Use fresh distilled water. Distilled water that’s been sitting open can absorb CO₂, drop in pH, and turn your BTB yellow before you’ve done anything. If your BTB looks yellow in distilled water instead of green, that’s usually the reason.
Pre-Lab: Getting to Know Bromothymol Blue
Before any quantitative work, students spend time observing how BTB responds to pH shifts.
They add small amounts of dilute acid and base to a BTB solution and capture the absorbance spectrum at each step, observing how the color and spectrum change.
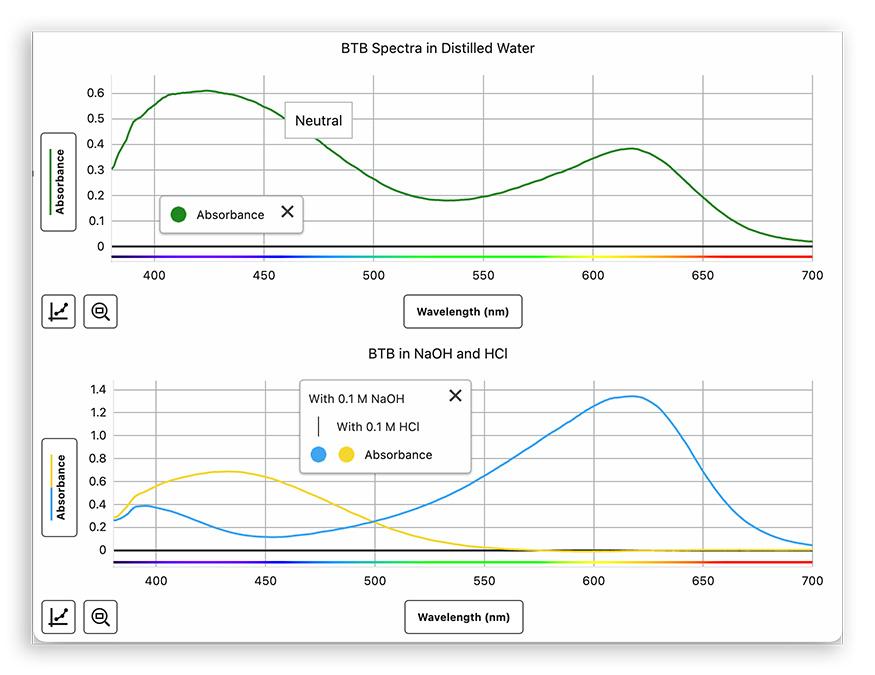
The goal is to identify the two peak wavelengths—one for each form of the indicator—that will anchor everything that follows.
It’s also a low-stakes way to get comfortable with Spectral Analysis app before the quantitative work begins.
Part I: Building the Beer’s Law Plots
Next, students prepare a set of solutions with known concentrations of bromothymol blue—one acidic (yellow) and one basic (blue).
Then they plot absorbance vs. concentration to determine the molar absorptivity (ε) at each wavelength peak. The slope of each linear plot gives them ε, the proportionality constant they’ll need to calculate unknown concentrations in Part II.
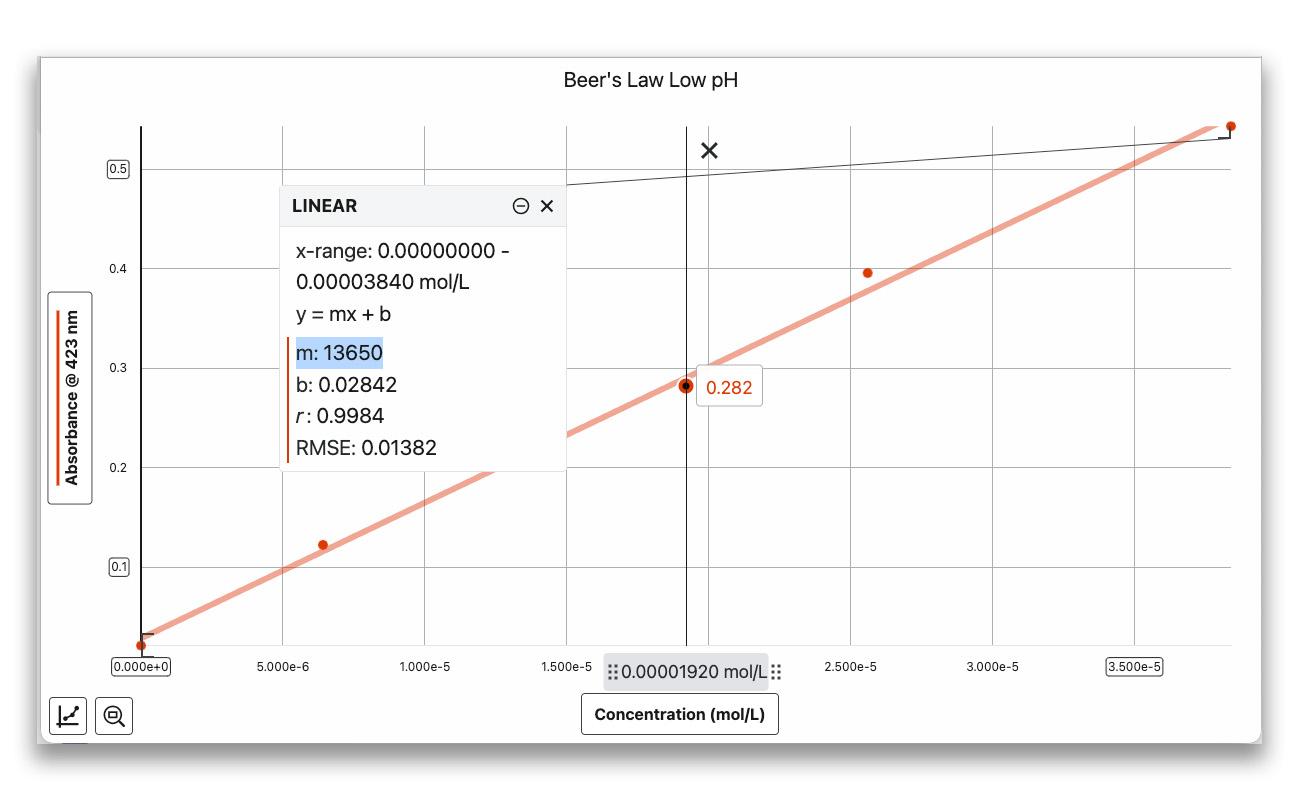
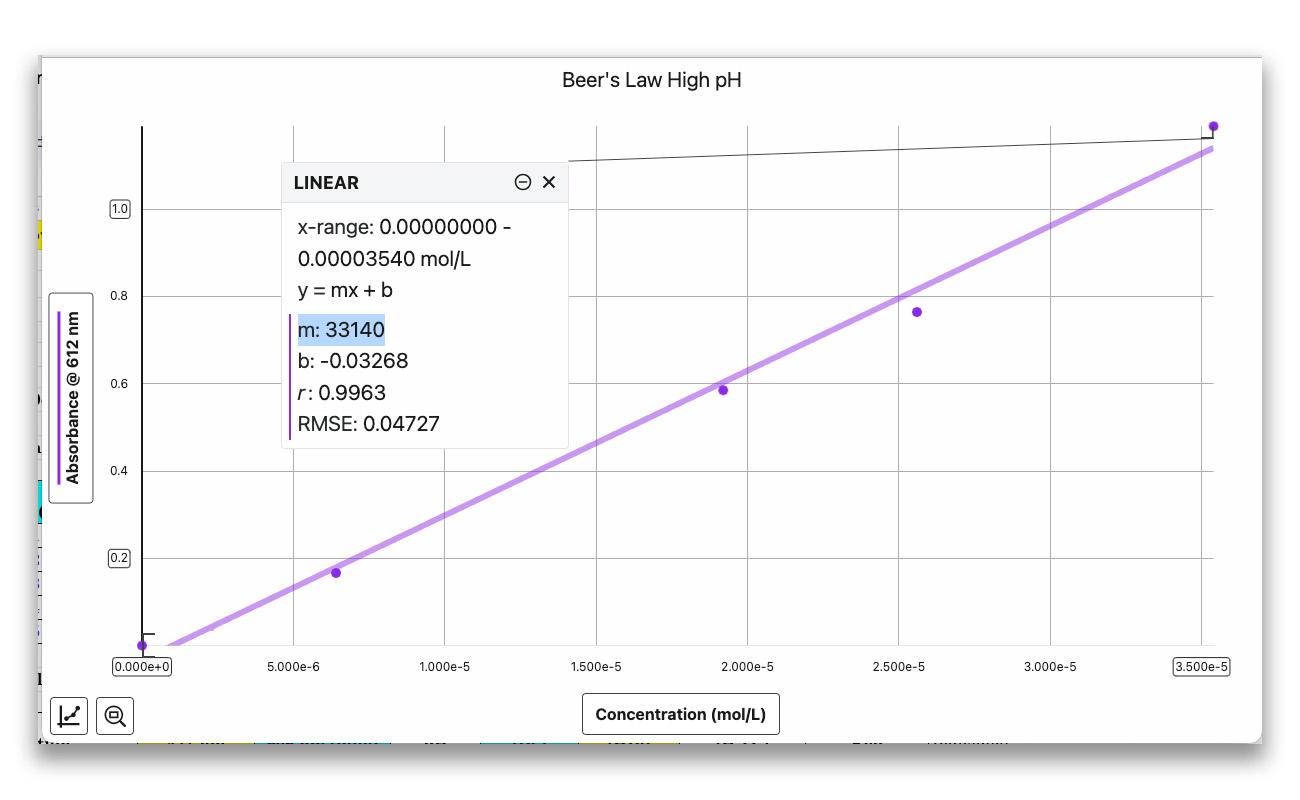
Fit each plot with a linear curve fit. The slope of the line is ε, the molar absorptivity constant.
Practical tip: Keep absorbance values below 1.0 for reliable Beer’s law data. If a solution exceeds this value, dilute it to a known concentration and re-measure.
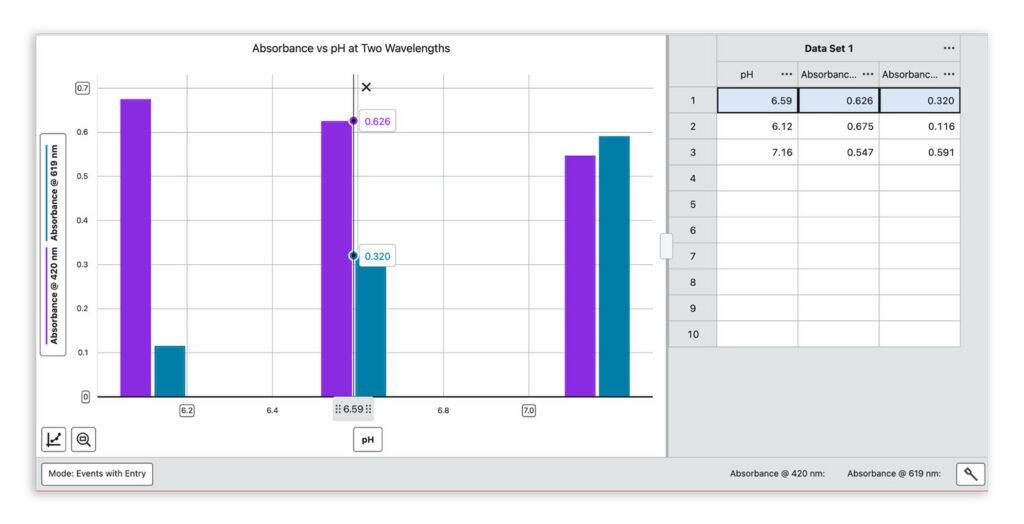
Part II: Measuring the Equilibrium Solutions
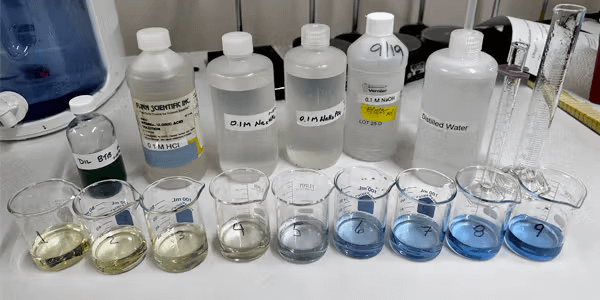
With Beer’s law plots in hand, students prepare three BTB solutions, each shifted to a slightly different pH using sodium hydrogen phosphates—gentle, safe reagents that nudge the equilibrium without overshooting it.
The target range is pH 6–7, where both BTB forms are present in measurable amounts.
For each solution, students measure
- pH using the Go Direct pH Sensor and the event-based mode in Graphical Analysis Pro
- Absorbance at both wavelengths in Spectral Analysis
That combination of pH and absorbance data is everything they need to solve for Keq.
Post Lab Analysis: Calculating Keq
Using the molar absorptivity values from the Beer’s law plots, students calculate the concentrations of HIn and In⁻ from the absorbance data.
The hydronium ion concentration is determined from the measured pH.
Substituting these values into the equilibrium expression yields a value for Keq.
If you’re teaching AP Chemistry, this is a natural place to connect to ICE tables and equilibrium expressions. Students aren’t just observing that equilibrium shifts—they’re quantifying it.
Practical Tips from the Lab
- Use three separate test tubes for the equilibrium solutions rather than modifying one sample repeatedly—it keeps your data clean and your pH in range.
- Stay in the pH 6–7 range. Outside this window, one form of BTB dominates and the absorbance of the other becomes too small to use reliably.
- The sodium hydrogen phosphates are potent—a single drop shifts the pH significantly. Encourage students to add small amounts and mix well before measuring.
- The event-based mode in Graphical Analysis Pro, along with custom text labels, annotations, and notes feature, makes data organization much easier. If you’re using the free version, students can use numbers and keep a separate key.
How It Supports 3D Learning
This experiment gives students sustained practice with planning and carrying out investigations, analyzing and interpreting data, and using mathematics and computational thinking to construct explanations.
The post-lab includes a dedicated question asking students to evaluate the experiment through the lens of green chemistry: waste minimization, safer solvents, energy efficiency, and proper disposal. It’s a good discussion starter, and students tend to surface more connections than you’d expect.
Want to See It in Action?
Watch the full webinar to see this experiment demonstrated live.
The resources folder includes the student experiment file, instructor notes, sample data, solution prep tables, and SDS references.
Watch the Webinar
Looking for other ways to teach equilibrium? Check out Why Did My Tea Turn Purple? for another colorful approach to this chemistry concept.
Have questions or want to share how it went in your classroom? Reach out at chemistry@vernier.com, call 888‑837‑6437, or drop us a line in the live chat. Looking for more? Check out our other green chemistry resources!
Share this Article
Related Articles


Sign up for our newsletter
Stay in the loop! Beyond Measure delivers monthly updates on the latest news, ideas, and STEM resources from Vernier.