Sharing ideas and inspiration for engagement, inclusion, and excellence in STEM
When I teach forces, friction is one of those topics where I really want students working hands‑on and looking closely at data. This fall, I used the Static and Kinetic Friction experiment from Physics with Vernier, and I added a variation that worked well in my classroom using a modified Atwood machine and a Go Direct® Motion Detector.
The physics of the lab stays the same. I just adjusted how the block moves to give students a motion profile that’s easy to analyze and produces a consistent, clear velocity‑time graph.
The Challenge: Getting Clean, Repeatable Data
In the standard setup, students slide a wooden block along the tabletop toward the motion detector. I’ve done that lab a few times in the past, and while it works conceptually, it can be hard to get consistent motion.
Blocks twist. They slide too close or not close enough. That inconsistency often shows up as noise in the data, which makes it harder for students to focus on the acceleration and what it tells them about friction.
I wanted a motion profile that was more repeatable, so we could focus on analyzing a really clean velocity curve showing acceleration. Two small changes made a big difference for me.
1. Flipping the Motion Detector Upside Down
One simple thing that helped in this particular experiment was flipping the motion detector upside down. With the detector inverted, it lines up better with the flat face of the block and keeps the block in the target window without needing to tape cardboard or use a larger target.

Quick setup note: We also switch the channel in Vernier Graphical Analysis® from Motion to Motion (cart) for this experiment. Using the cart setting, along with flipping the detector, gave us the cleanest and most consistent data.
Those two small tweaks reduced variability almost immediately when students released the block.
2. Using a Modified Atwood Machine
Instead of sliding the block toward the motion detector, I turned the setup around so the block starts close to the detector and moves away from it.
of the block.
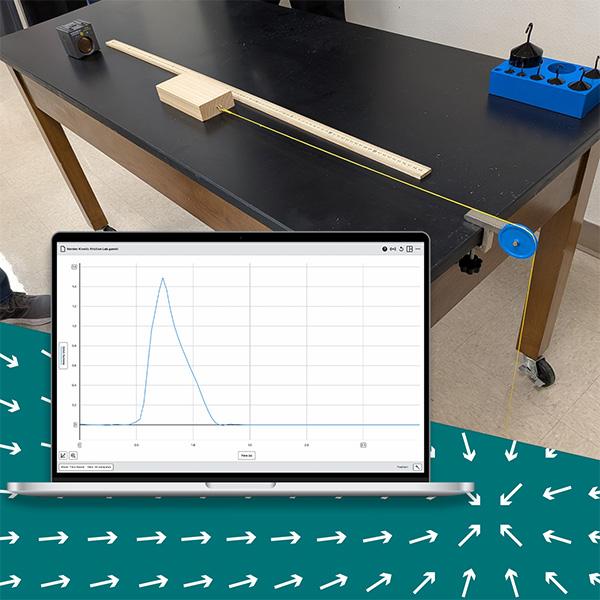
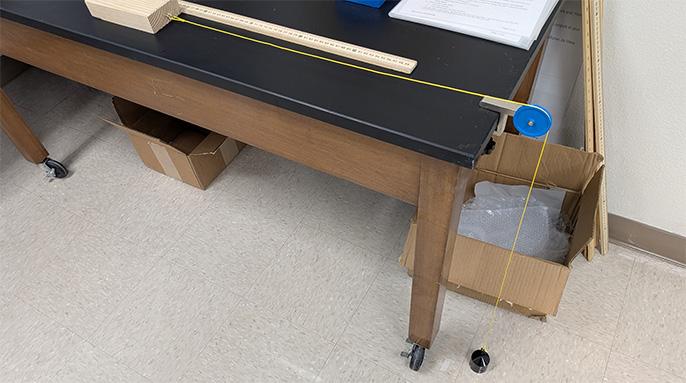
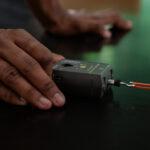
I use a modified Atwood machine: a pulley clamped to the table, a small hanging mass, and a string connected to the block. The (inverted) motion detector sits at the zero mark, facing the block.
Students pull the string taut and place the block at about the 40 cm mark, and confirm the correct distance is displayed in the graph meter.
Then they pull it back to around 20 cm—right to the edge of what the sensor can detect—and let go. The hanging mass pulls the block briefly, then hits the floor. Once that happens, the force is gone and the block slides to a stop under friction alone.

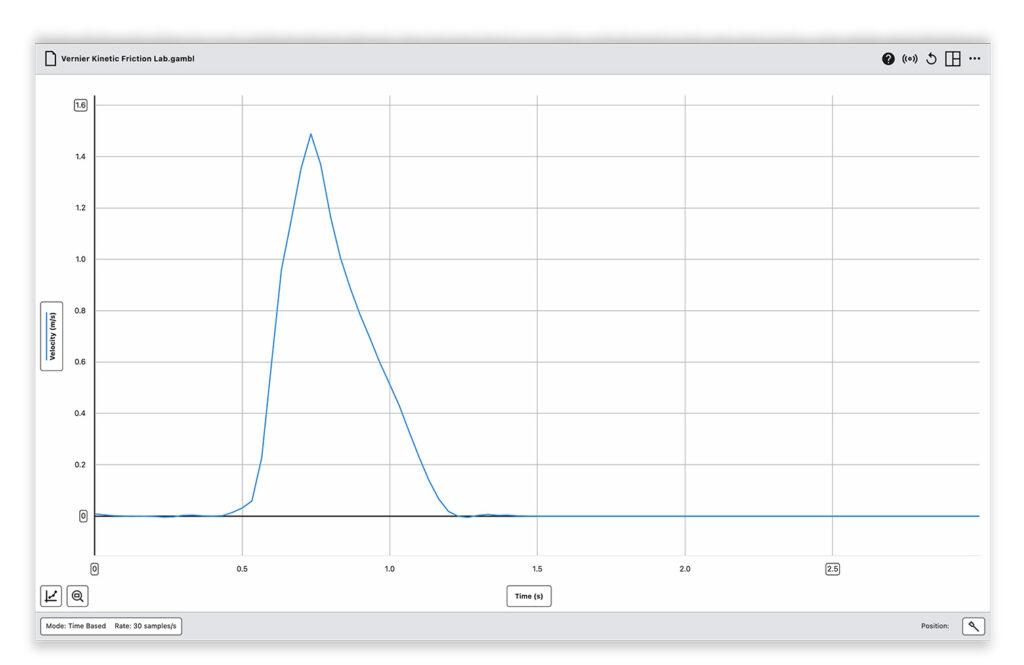
That gives a very clean velocity curve, clearly showing speeding up then slowing down, which is exactly what I want students to analyze.
One practical thing we learned early on: It helps to put something soft under the hanging mass. If it hits the floor hard, the motion detector can sometimes pick that up as a spike in the data.
How Cleaner Data Changed the Lab and Boosted Engagement
Once students have a clean velocity‑time graph, the analysis becomes much more focused. They select two points from the deceleration portion of the graph and calculate acceleration from the slope. From there, they determine the coefficient of kinetic friction.
I could have them rely on the software’s calculated acceleration, but I intentionally have students do the math themselves. That step reinforces what the slope of a velocity‑time graph actually represents, and it gives them more ownership of the result.
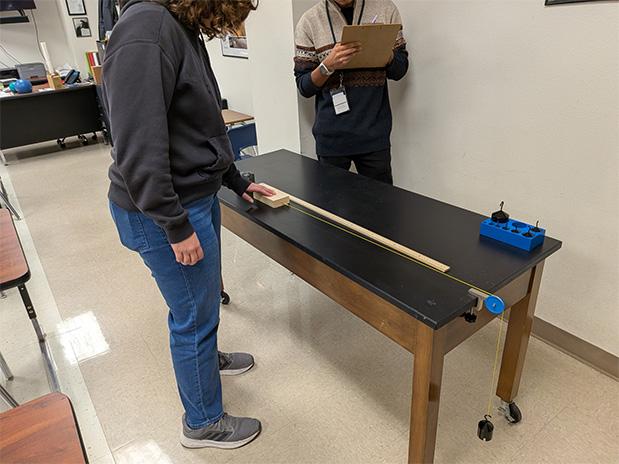
This is where I really saw the payoff in class. Because the motion was consistent, most groups got usable data quickly, and we spent far less time re‑running trials. Students stayed engaged throughout the lab. Anytime they’re working hands‑on, they’re more invested, and there’s enough technique involved that they have to pay attention to what they’re doing, but it’s still approachable and easy for them to master.
We also talk about why friction matters. When students ask why we care about the coefficient of friction, I usually tell them, “You think friction is bad until you drive on an icy road! Another word for friction is traction. If you don’t think it’s important, try driving without them.”
Quick Classroom Takeaways
- Flip the motion detector upside down to keep the block centered in the target window.
- Switch the channel to Motion (cart) for cleaner velocity data.
- Pad the landing spot for the hanging mass to reduce noise in the velocity graph.
- Mark consistent start positions on the table to improve repeatability.
- Have students calculate acceleration by hand to reinforce what slope represents.
- Let students handle setup—the technique is part of the learning.

Jeffrey Overbay teaches physics and astronomy at Long Creek High School in New Braunfels, Texas, and is a member of the Vernier Trendsetters Community. With over a decade of experience in K–12 science education, Jeff is passionate about inspiring students to investigate physics through hands-on exploration.
Share this Article
Related Articles


Sign up for our newsletter
Stay in the loop! Beyond Measure delivers monthly updates on the latest news, ideas, and STEM resources from Vernier.