Introduction
There are times when we may need to communicate information in a non-visual format. For example, at many intersections traffic signals emit audible tones when the light is green so people with visual impairments will know it is safe to enter the crosswalk. One tone is played when the light is green in the north/south direction, and a different tone is played when the light is green in the east/west direction. As another example, there are times when it is difficult for an operator to read numbers from a dial or a meter, such as in a professional laundry where the instruments are frequently clouded with steam. The operator may not need to know the exact value of the meter reading, but he or she does need to know if the value has exceeded an acceptable working range. In this situation, a device that sounds an alert can be useful.
Objectives
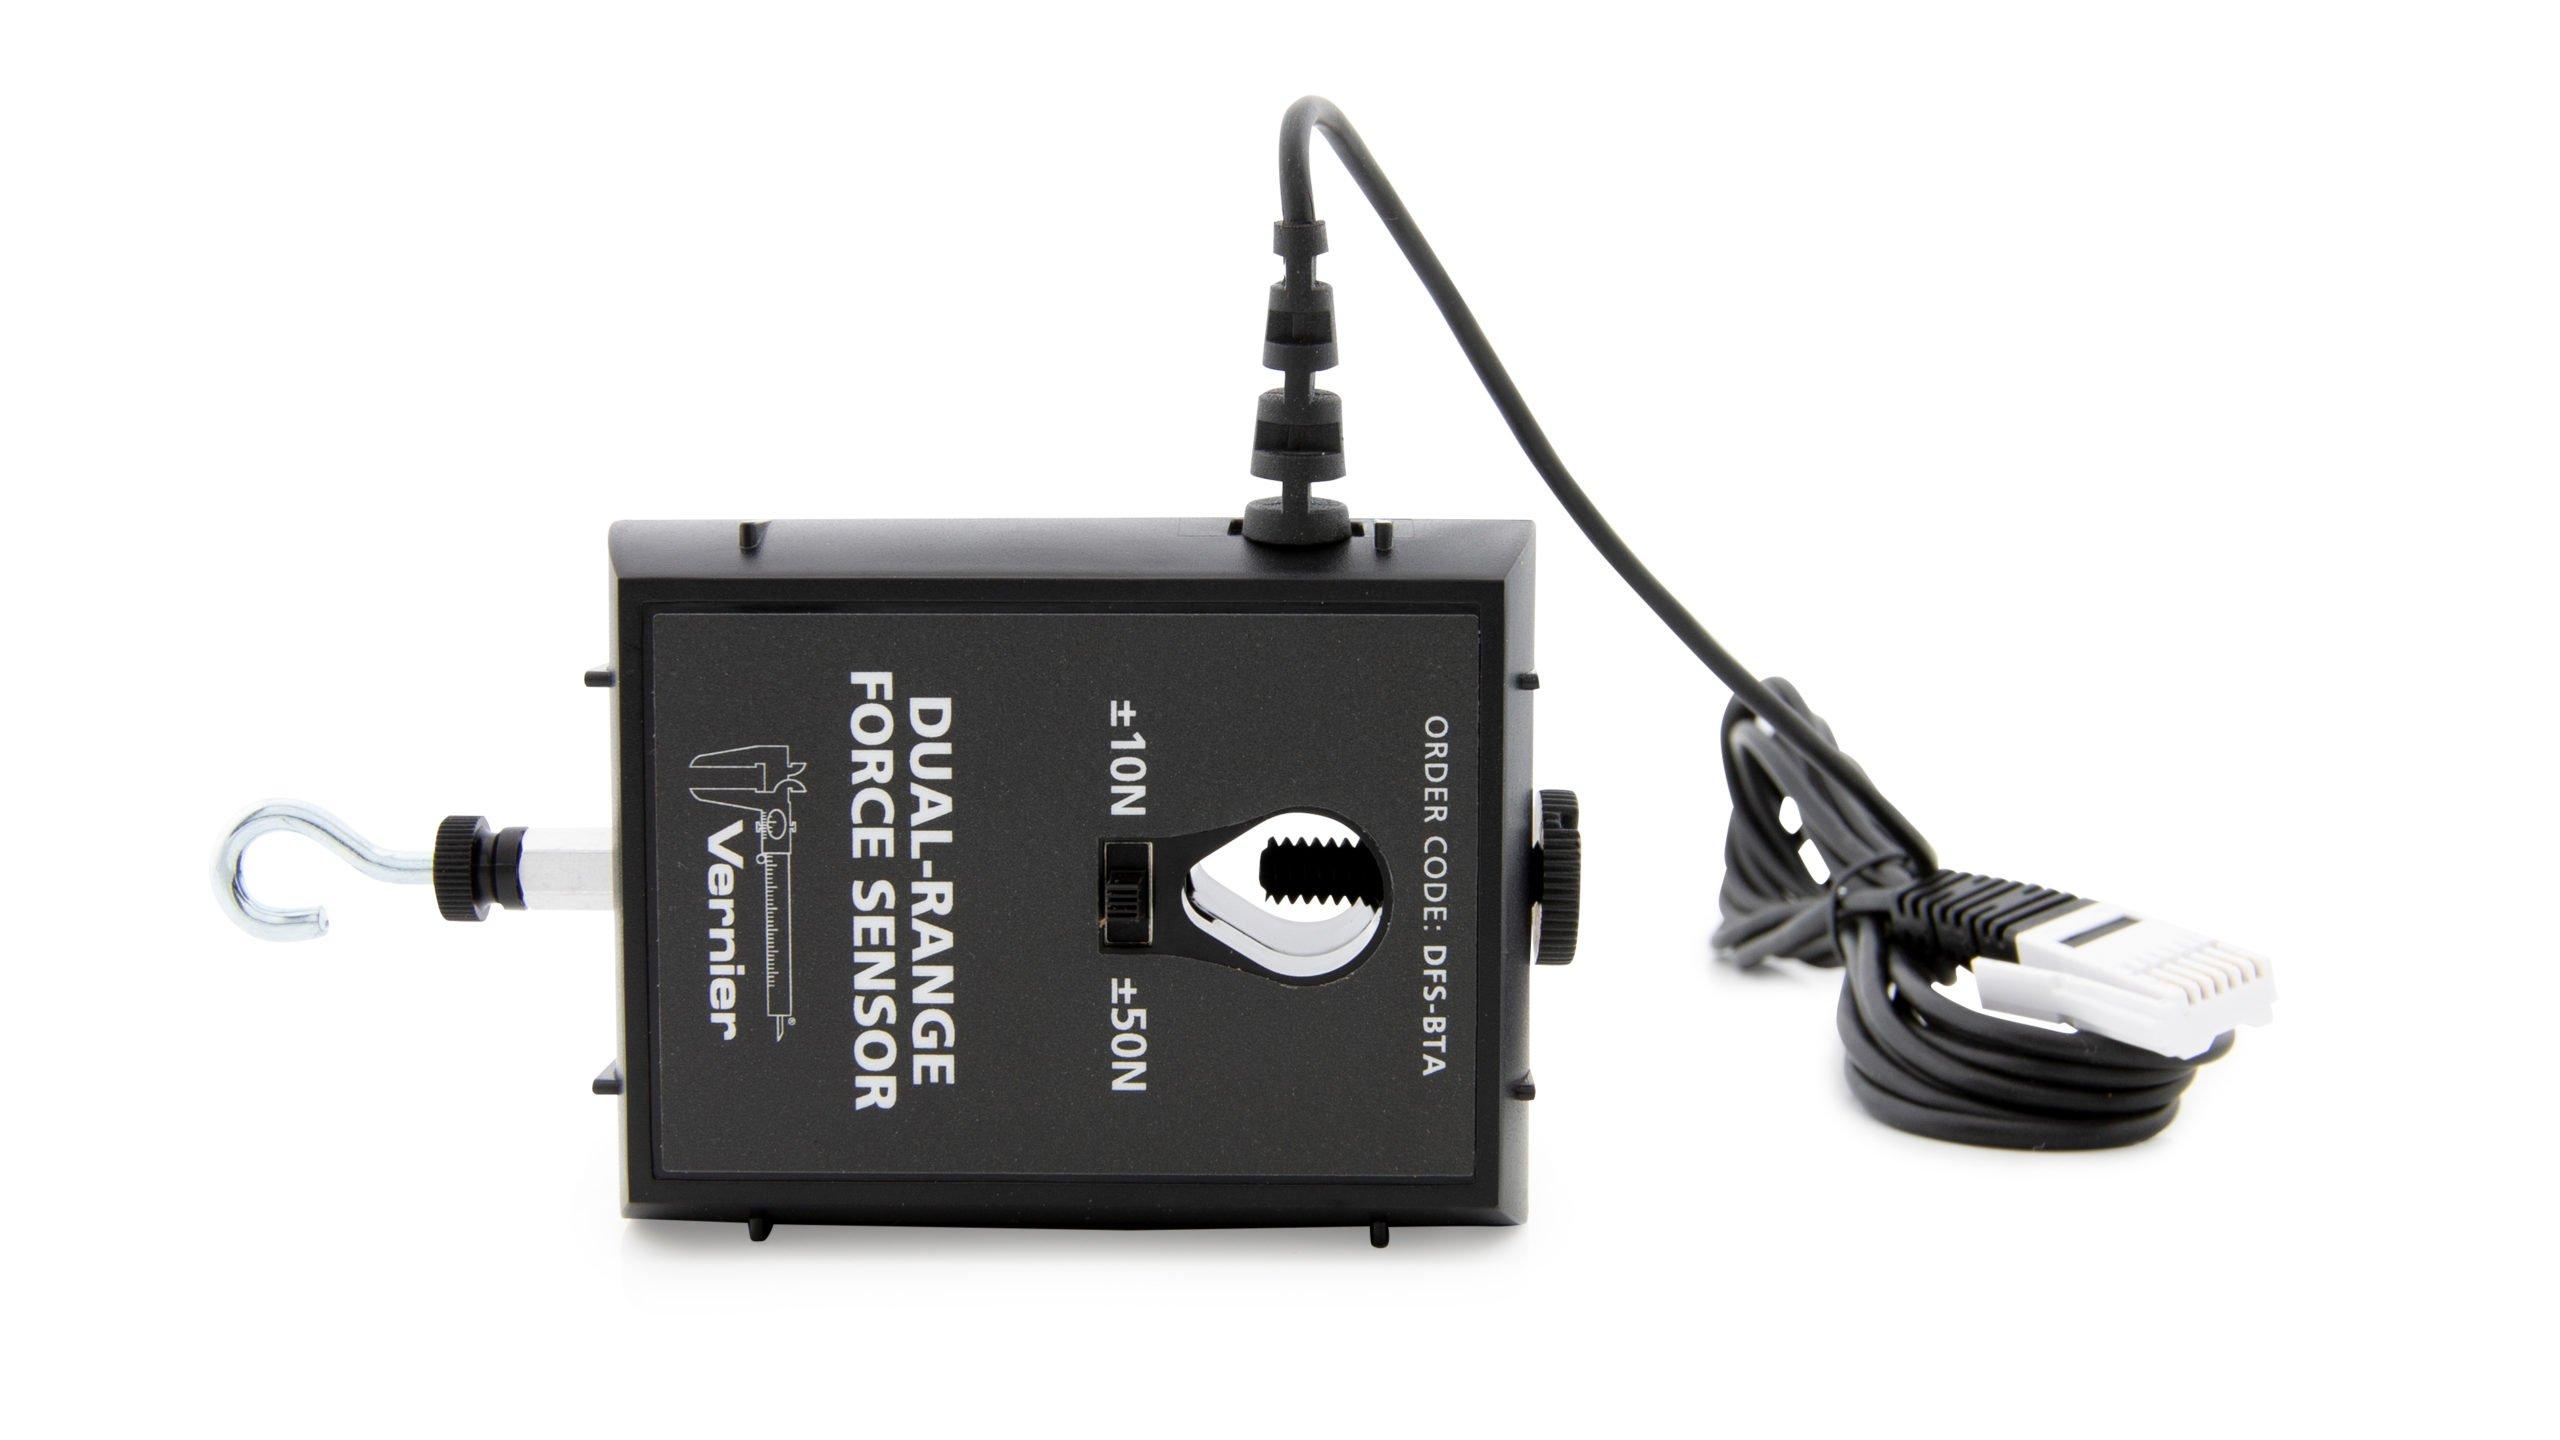
In this project, your challenge is to design and build a device to give an audio indicator of the pulling force exerted on a Vernier Dual-Range Force Sensor. You must build some type of structure that will allow the operator to apply a pulling force to the sensor without touching the sensor directly. Your device must be able to indicate the relative strength of the applied force using sound. The frequency of your tone should be directly proportional to the measurement from the Force Sensor. In other words, a high-pitched sound for a high value and a low-pitched sound for a low value.
Sensors and Equipment
This experiment features the following sensors and equipment. Additional equipment may be required.
Ready to Experiment?
Ask an Expert
Get answers to your questions about how to teach this experiment with our support team.
- Call toll-free: 888-837-6437
- Chat with Us
- Email support@vernier.com