Introduction
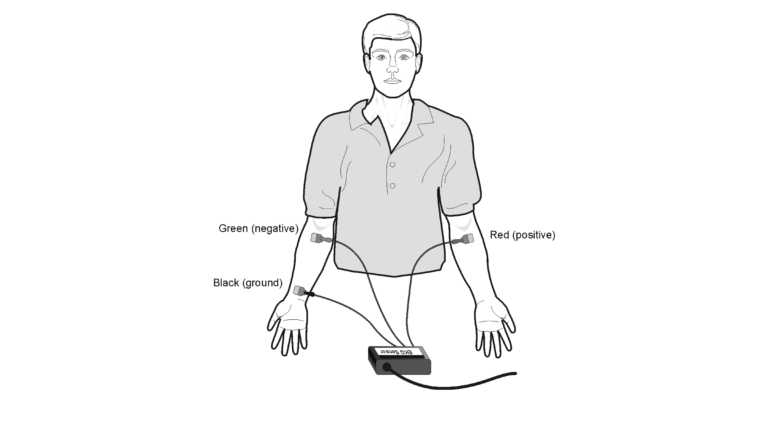
An electrocardiogram (ECG or EKG) is a graphical recording of the electrical events occurring within the heart. In a healthy heart there is a natural pacemaker in the right atrium (the sinoatrial node) which initiates an electrical sequence. This impulse then passes down natural conduction pathways between the atria to the atrioventricular node and from there to both ventricles. The natural conduction pathways facilitate orderly spread of the impulse and coordinated contraction of first the atria and then the ventricles. The electrical journey creates unique deflections in the EKG that tell a story about heart function and health. Even more information is obtained by looking at the story from different angles, which is accomplished by placing electrodes in various positions on the chest and extremities. A positive deflection in an EKG tracing represents electrical activity moving toward the active lead (the green lead in this experiment).
Objectives
In this experiment, you will
- Obtain graphical representation of the electrical activity of the heart over a period of time.
- Learn to recognize the different wave forms seen in an EKG, and associate these wave forms with activity of the heart.
- Determine the heart rate by determining the rate of individual wave forms in the EKG.
- Compare wave forms generated by alternate EKG lead placements.
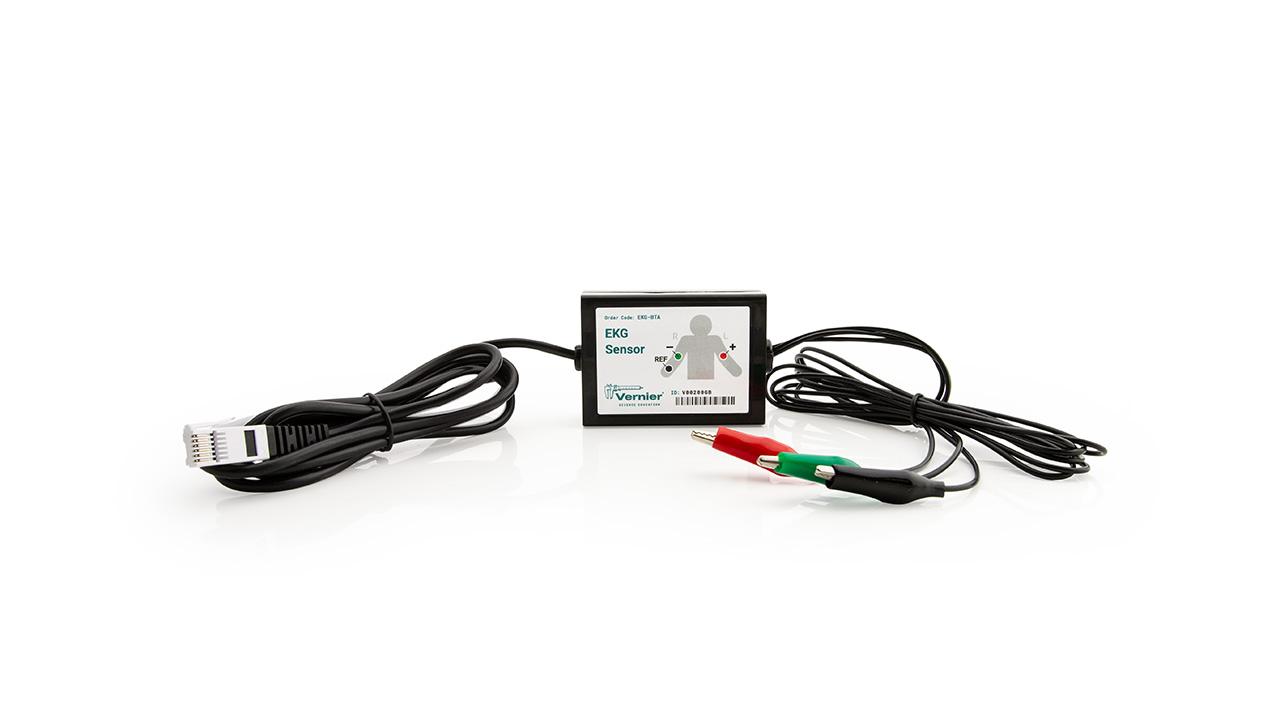
Sensors and Equipment
This experiment features the following sensors and equipment. Additional equipment may be required.
Ready to Experiment?
Ask an Expert
Get answers to your questions about how to teach this experiment with our support team.
- Call toll-free: 888-837-6437
- Chat with Us
- Email support@vernier.com
Purchase the Lab Book
This experiment is #12 of Human Physiology with Vernier. The experiment in the book includes student instructions as well as instructor information for set up, helpful hints, and sample graphs and data.