Introduction
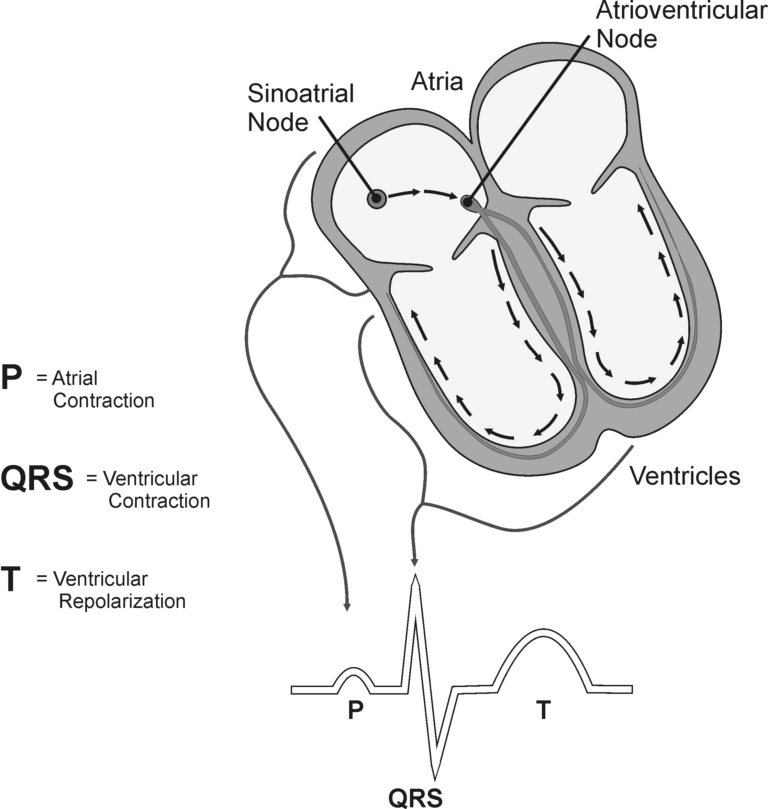
An electrocardiogram (ECG or EKG) is a graphical recording of the electrical events occurring within the heart. In a healthy heart there is a natural pacemaker in the right atrium (the sinoatrial node) which initiates an electrical sequence. This impulse then passes down natural conduction pathways between the atria to the atrioventricular node and from there to both ventricles. The natural conduction pathways facilitate orderly spread of the impulse and coordinated contraction of first the atria and then the ventricles. The electrical journey creates unique deflections in the EKG that tell a story about heart function and health. Even more information is obtained by looking at the story from different angles, which is accomplished by placing electrodes in various positions on the chest and extremities. A positive deflection in an EKG tracing represents electrical activity moving toward the active lead (the green lead in this experiment).
Five components of a single beat are traditionally recognized and labeled P, Q, R, S, and T. The P wave represents the start of the electrical journey as the impulse spreads from the sinoatrial node downward from the atria through the atrioventricular node and to the ventricles. Ventricular activation is represented by the QRS complex. The T wave results from ventricular repolarization, which is a recovery of the ventricular muscle tissue to its resting state. By looking at several beats you can also calculate the rate for each component.
Doctors and other trained personnel can look at an EKG tracing and see evidence for disorders of the heart such as abnormal slowing, speeding, irregular rhythms, injury to muscle tissue (angina), and death of muscle tissue (myocardial infarction). The length of an interval indicates whether an impulse is following its normal pathway. A long interval reveals that an impulse has been slowed or has taken a longer route. A short interval reflects an impulse which followed a shorter route. If a complex is absent, the electrical impulse did not rise normally, or was blocked at that part of the heart. Lack of normal depolarization of the atria leads to an absent P wave. An absent QRS complex after a normal P wave indicates the electrical impulse was blocked before it reached the ventricles. Abnormally shaped complexes result from abnormal spread of the impulse through the muscle tissue, such as in myocardial infarction where the impulse cannot follow its normal pathway because of tissue death or injury. Electrical patterns may also be changed by metabolic abnormalities and by various medicines.
In this experiment, you will use the EKG sensor to make a five second graphical recording of your heart’s electrical activity, and then switch the red and green leads to simulate the change in electrical activity that can occur with a myocardial infarction (heart attack). You will identify the different components of the waveforms and use them to determine your heart rate. You will also determine the direction of electrical activity for the QRS complex.
Objectives
- Obtain graphical representation of the electrical activity of the heart over a period of time.
- Learn to recognize the different wave forms seen in an EKG, and associate these wave forms with activity of the heart.
- Determine the heart rate by determining the rate of individual wave forms in the EKG.
- Compare wave forms generated by alternate EKG lead placements.
Sensors and Equipment
This experiment features the following sensors and equipment. Additional equipment may be required.

Ready to Experiment?
Ask an Expert
Get answers to your questions about how to teach this experiment with our support team.
- Call toll-free: 888-837-6437
- Chat with Us
- Email support@vernier.com
Purchase the Lab Book
This experiment is #8 of Human Physiology Experiments: Volume 1. The experiment in the book includes student instructions as well as instructor information for set up, helpful hints, and sample graphs and data.