Introduction
When you examined an object moving with constant velocity in introductory Activity 2, you learned two important points about the line of best fit to the graph of position vs. time:
- The slope (rate of change) of the graph was constant and gave the velocity of the object.
- The intercept gave the initial position of the object.
In this experiment, you will examine a different kind of motion and contrast features of the position-time and velocity-time graphs with those you have studied earlier.
Objectives
In this experiment, you will
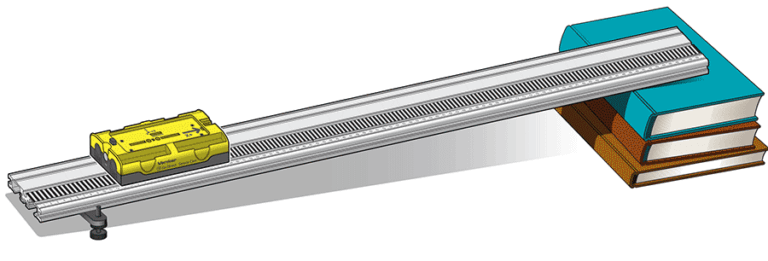
- Collect position, velocity, and time data as a cart rolls up and down an inclined track.
- Analyze the position vs. time and velocity vs. time graphs.
- Determine the best fit equations for the position vs. time and velocity vs. time graphs.
- Distinguish between average and instantaneous velocity.
- Use analysis of motion data to define instantaneous velocity and acceleration.
- Relate the parameters in the best-fit equations for position vs. time and velocity vs. time graphs to their physical counterparts in the system.
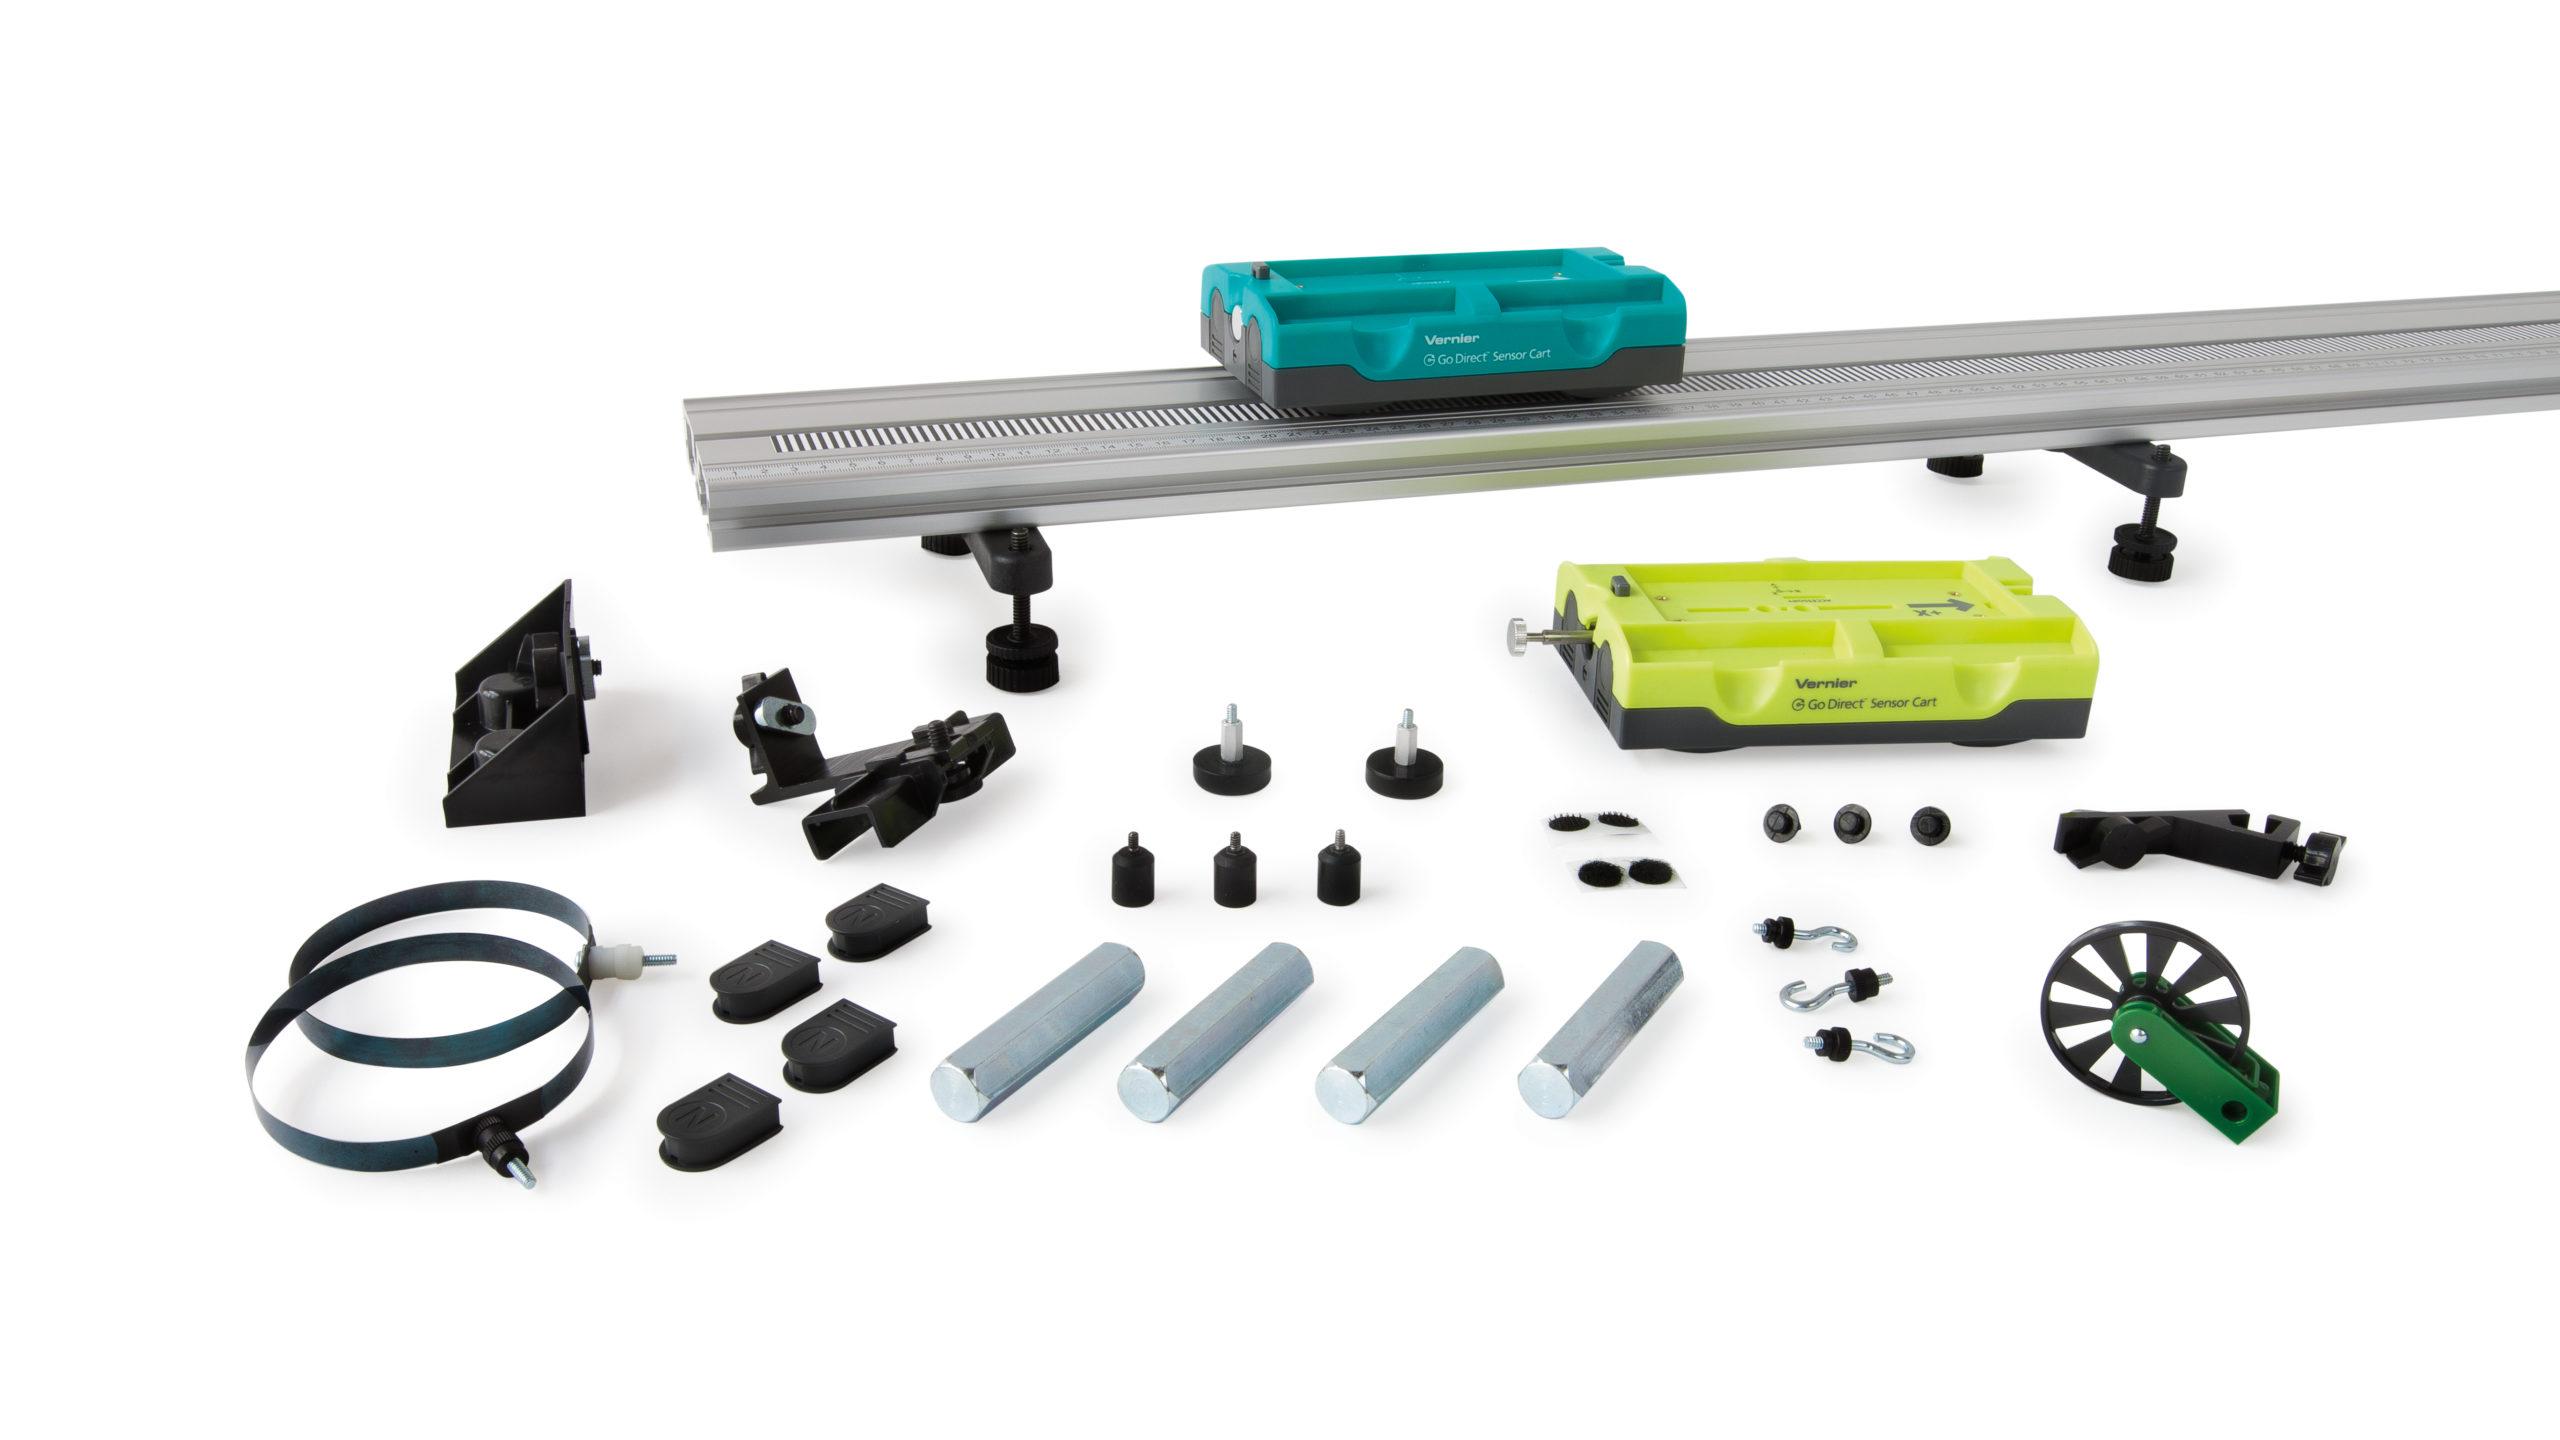
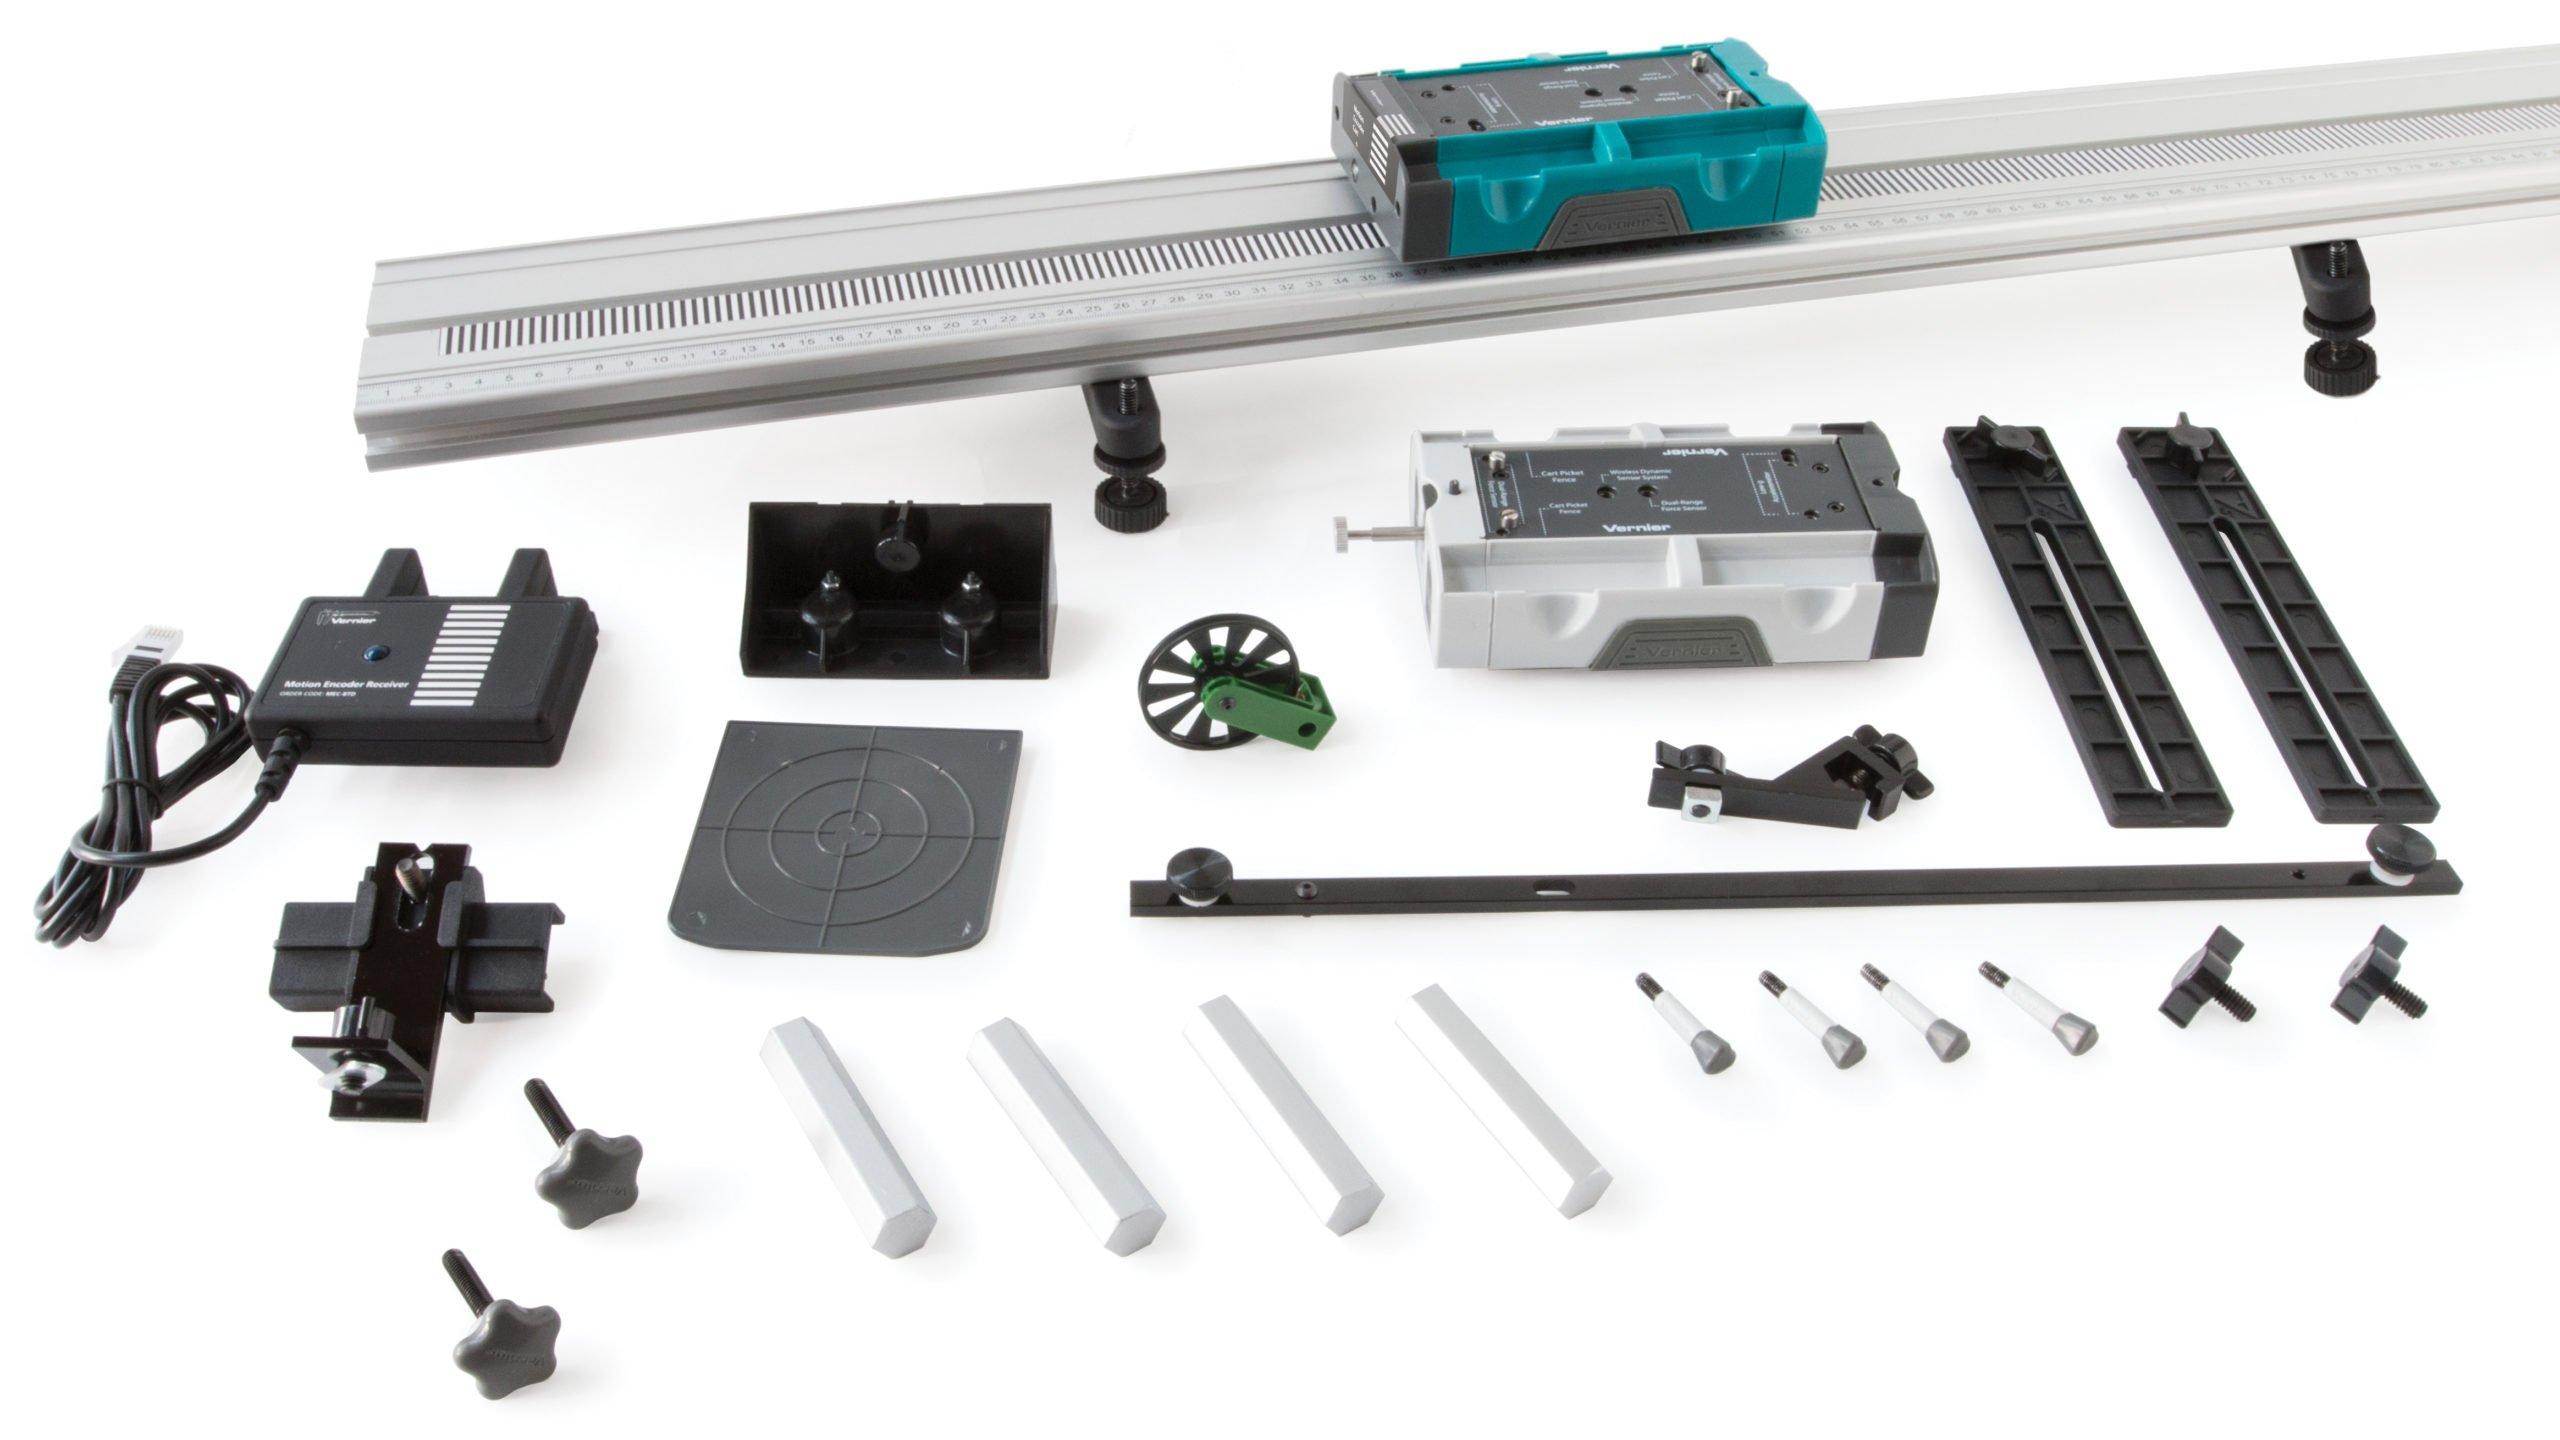
Sensors and Equipment
This experiment features the following sensors and equipment. Additional equipment may be required.


Ready to Experiment?
Ask an Expert
Get answers to your questions about how to teach this experiment with our support team.
- Call toll-free: 888-837-6437
- Chat with Us
- Email support@vernier.com
Purchase the Lab Book
This experiment is #1 of Advanced Physics with Vernier — Mechanics. The experiment in the book includes student instructions as well as instructor information for set up, helpful hints, and sample graphs and data.