Video Overview
Introduction
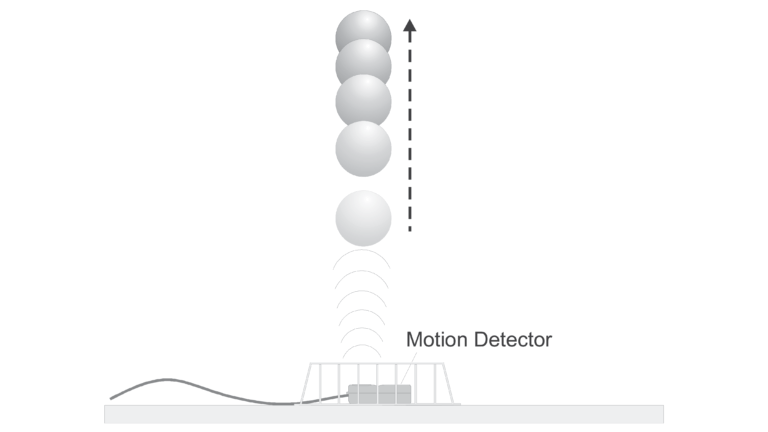
When a juggler tosses a ball straight upward, the ball slows down until it reaches the top of its path. The ball then speeds up on its way back down. A graph of its velocity vs. time would show these changes. Is there a mathematical pattern to the changes in velocity? What is the accompanying pattern to the position vs. time graph? What would the acceleration vs. time graph look like?
In this experiment, you will use a Motion Detector to collect position, velocity, and acceleration data for a ball thrown straight upward. Analysis of the graphs of this motion will answer the questions asked above.
Objectives
- Collect position, velocity, and acceleration data as a ball travels straight up and down.
- Analyze position vs. time, velocity vs. time, and acceleration vs. time graphs.
- Determine the best-fit equations for the position vs. time and velocity vs. time graphs.
- Determine the mean acceleration from the acceleration vs. time graph.
Sensors and Equipment
This experiment features the following sensors and equipment. Additional equipment may be required.
Option 1

Option 2

Option 3

Ready to Experiment?
Ask an Expert
Get answers to your questions about how to teach this experiment with our support team.
- Call toll-free: 888-837-6437
- Chat with Us
- Email support@vernier.com
Purchase the Lab Book
This experiment is #6 of Physics with Vernier. The experiment in the book includes student instructions as well as instructor information for set up, helpful hints, and sample graphs and data.