Velocity Test – Interpreting Graphs
Experiment #12 from Real-World Math with Vernier
- Education Level
- High School
Introduction
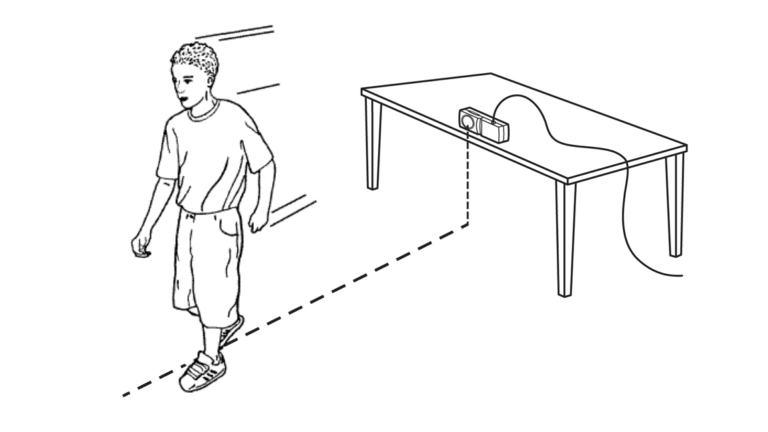
When you walk, ride a bike, or travel in a car, you are often interested in the distance traveled, the time it took, and the speed or velocity of your motion. In this activity, you will learn more about how these four quantities are related.
Speed and velocity are often confused since the terms are sometimes used interchangeably, but they are not the same thing. So what is the difference? Speed is how far you have gone, divided by the time it took to move. In other words, speed tells how fast you are traveling, but without regard to direction. Since the distance you have traveled is always positive, speed is always positive.
On the other hand, velocity is the rate of change of position. Position is the directed distance from a chosen starting point, or origin. If we consider only motion on the positive side of the origin, motion away from the origin is a positive change in position, while motion toward the origin is a negative change in position. Velocity can, therefore, be either positive or negative depending upon your direction of motion. The data from a Motion Detector is a directed distance, so it can easily be used to calculate velocity.
Objectives
- Record distance versus time data for a simple motion of a walker.
- Analyze the distance versus time data to sketch the form of a corresponding velocity versus time graph.
- Compare this velocity graph with the velocity graph determined by DataQuest.
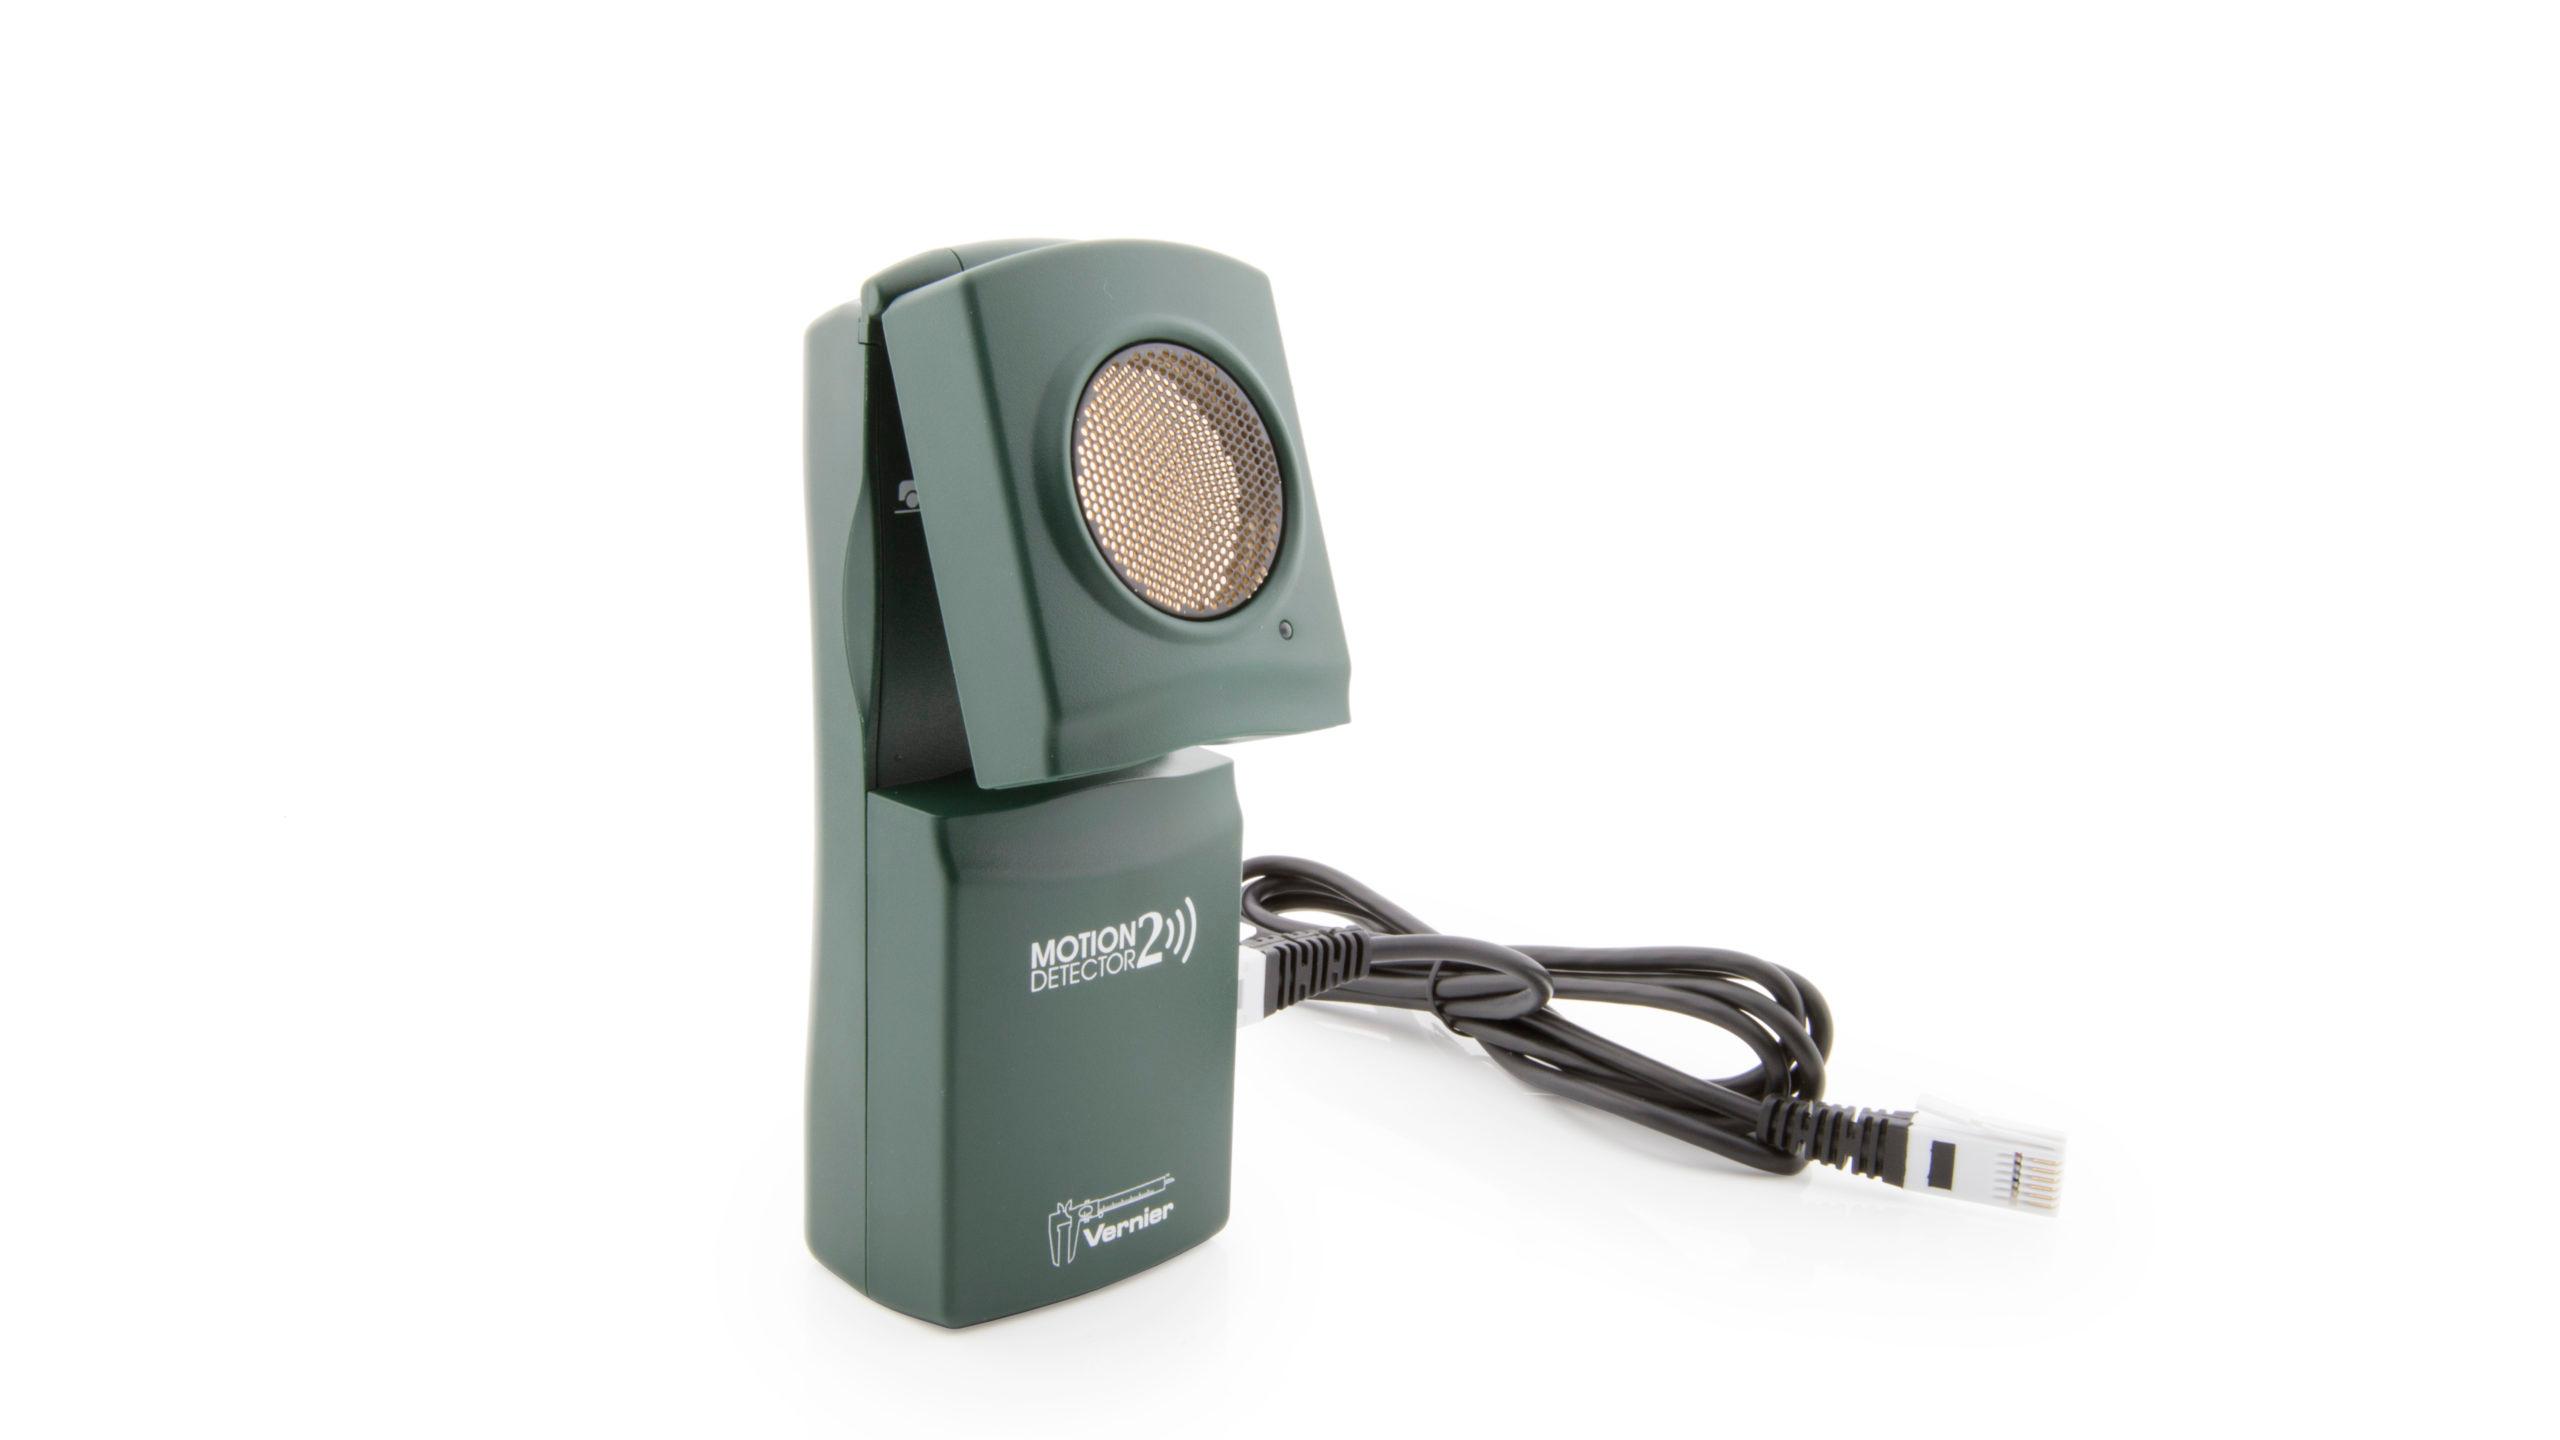
Sensors and Equipment
This experiment features the following sensors and equipment. Additional equipment may be required.
Option 1
Option 2

Ready to Experiment?
Ask an Expert
Get answers to your questions about how to teach this experiment with our support team.
- Call toll-free: 888-837-6437
- Chat with Us
- Email support@vernier.com
Purchase the Lab Book
This experiment is #12 of Real-World Math with Vernier. The experiment in the book includes student instructions as well as instructor information for set up, helpful hints, and sample graphs and data.