Titration Curves: An Application of the Logistic Function
Experiment #28 from Real-World Math with Vernier
- Education Level
- High School
Introduction
Think about how cold germs spread through a school. One person comes to class with a cold and infects other students. At first, the disease spreads slowly, but as more students catch cold and spread it to other classmates, the disease spreads more rapidly. The rate of infection slows down again when most students are infected and there is no one left at school to infect. The maximum number of students in the school who can contract the disease is the number of students in the school.
A logistic function is often used to model this type of situation. The logistic function is an exponential function, but it contains a ratio and offset which make its behavior interesting. The formula for a logistic function is:
In this activity, you will add base to an acid and use a logistic function to model the data and locate the equivalence point.
Objectives
- Record pH versus base volume data for an acid-base titration.
- Manually model the titration curve using a logistic function.
- Describe the role of each parameter in the logistic function.
Sensors and Equipment
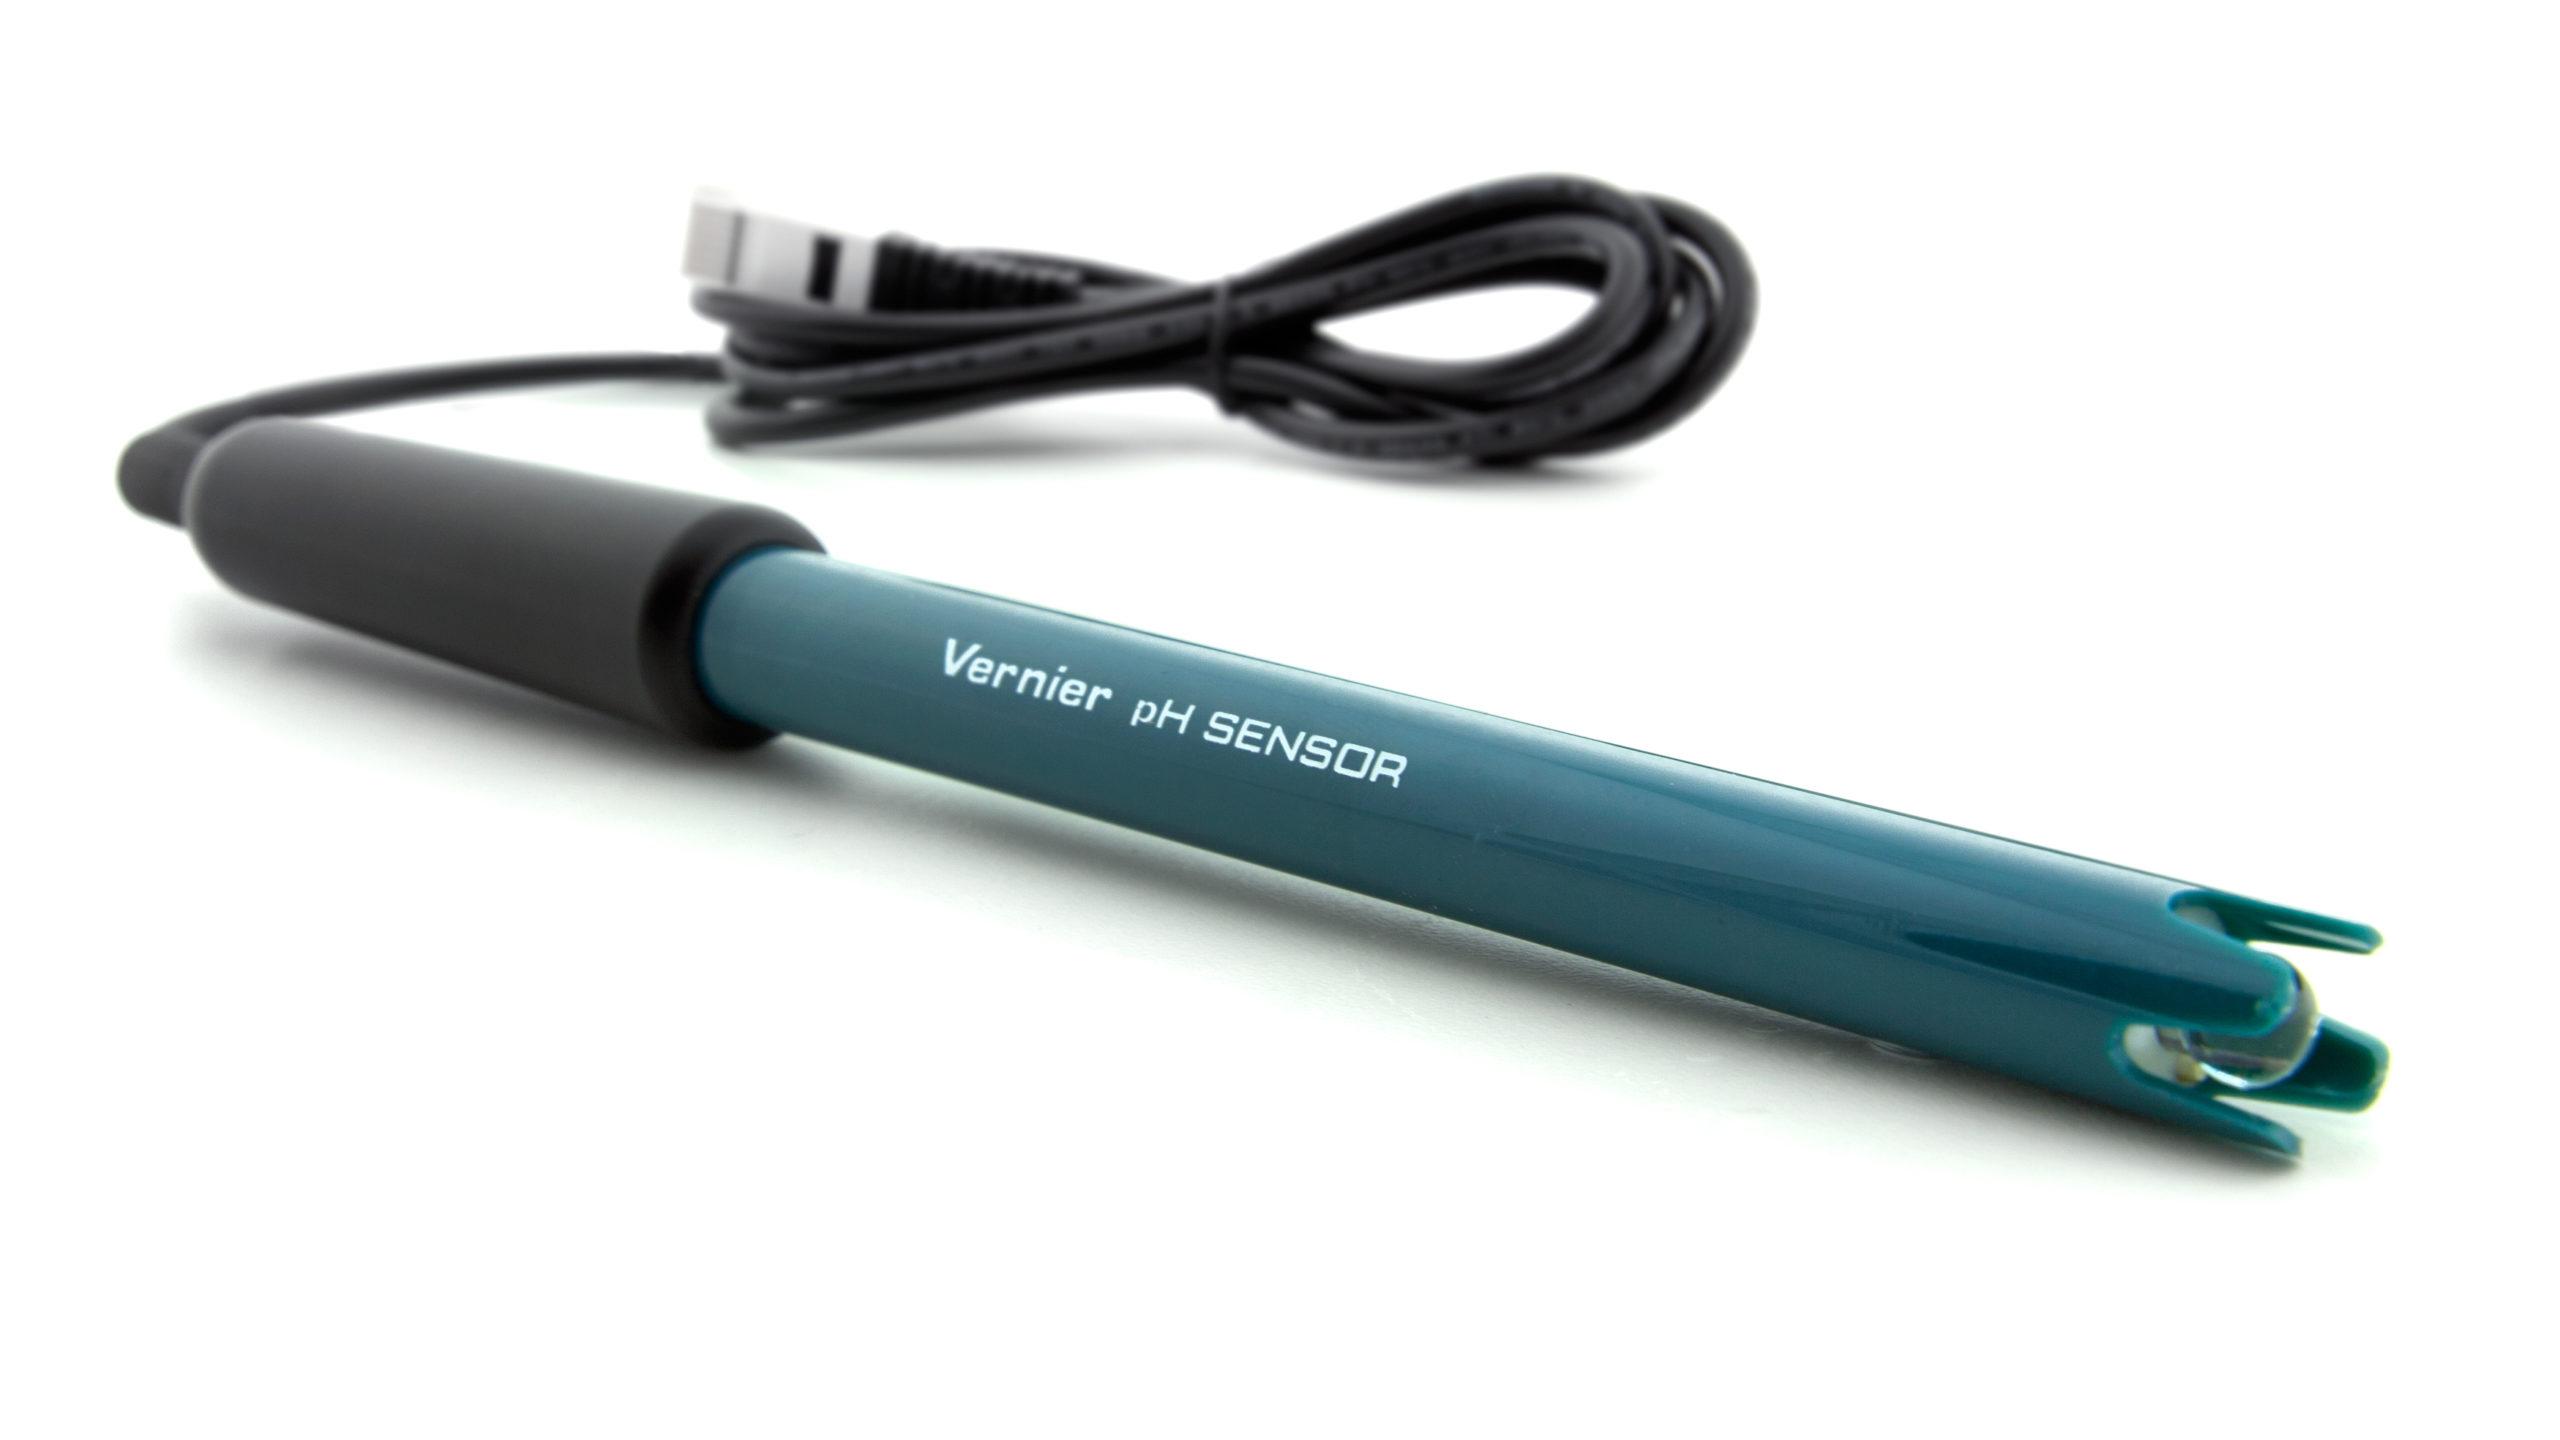
This experiment features the following sensors and equipment. Additional equipment may be required.
Ready to Experiment?
Ask an Expert
Get answers to your questions about how to teach this experiment with our support team.
- Call toll-free: 888-837-6437
- Chat with Us
- Email support@vernier.com
Purchase the Lab Book
This experiment is #28 of Real-World Math with Vernier. The experiment in the book includes student instructions as well as instructor information for set up, helpful hints, and sample graphs and data.


