Crawling Around: Parametric Plots
Experiment #32 from Real-World Math with Vernier
- Education Level
- High School
Introduction
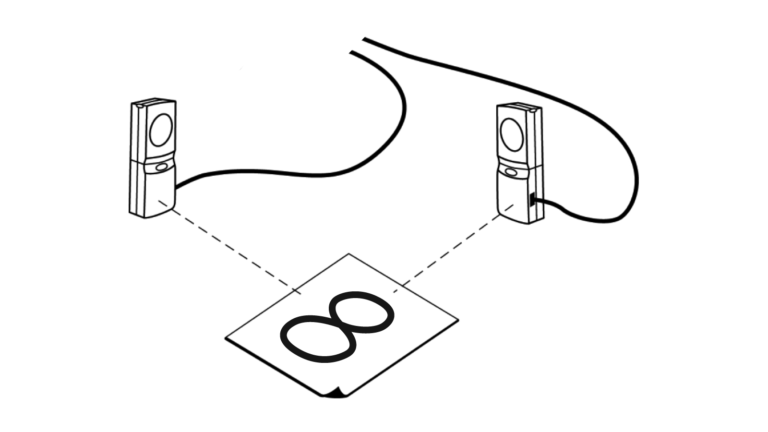
Imagine you are observing a bug crawling around in a figure eight path on the floor. If we define a Cartesian x, y plane on the floor, and you wished to completely describe the bug’s movements graphically, you would need to create a graph in three dimensions. This graph would need one axis to describe the x movement of the bug, another axis for its y movement, and a third axis for the time elapsed during the motion.
It is difficult to portray a graph in three dimensions on two-dimensional paper. It is relatively simple, however, to create a two-dimensional graph.
In this activity, you will model the bug’s movement by breaking the motion down into its x and y components. You can then use parametric equations to separately describe each of these components as a function of time. Finally, you will use the parametric mode in your calculator to combine these graphs and create a model that describes the motion of the bug.
Objectives
- Record the x– and y-coordinates of a rod moving in a figure-eight pattern.
- Use the recorded motion information to separately model the x– and y– motion as a function of time.
- Plot the experimental data in a y versus x graph.
- Plot the x– and y-models parametrically for comparison to the experimental data.
Sensors and Equipment
This experiment features the following sensors and equipment. Additional equipment may be required.
Option 1

Option 2

Ready to Experiment?
Ask an Expert
Get answers to your questions about how to teach this experiment with our support team.
- Call toll-free: 888-837-6437
- Chat with Us
- Email support@vernier.com
Purchase the Lab Book
This experiment is #32 of Real-World Math with Vernier. The experiment in the book includes student instructions as well as instructor information for set up, helpful hints, and sample graphs and data.