What Goes Up – Position and Time for a Cart on a Ramp
Experiment #9 from Real-World Math with Vernier
- Education Level
- High School
Introduction
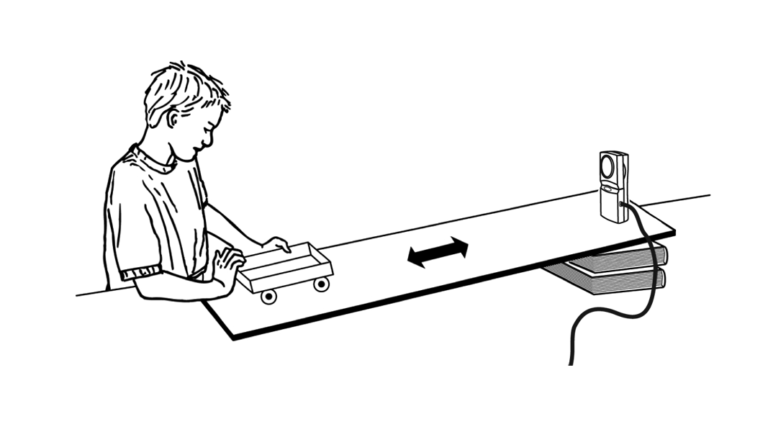
When a cart is given a brief push up a ramp, it will roll back down again after reaching its highest point. Algebraically, the relationship between the position and elapsed time for the cart is quadratic in the general form

where y represents the position of the cart on the ramp and x represents the elapsed time. The quantities a, b, and c are parameters which depend on such things as the inclination angle of the ramp and the cart’s initial speed. Although the cart moves back and forth in a straight-line path, a plot of its position along the ramp graphed as a function of time is parabolic.
Objectives
- Record position versus time data for a cart rolling up and down a ramp.
- Determine an appropriate parabolic model for the position data using the x– and y– intercept information.
Sensors and Equipment
This experiment features the following sensors and equipment. Additional equipment may be required.
Option 1

Option 2

Ready to Experiment?
Ask an Expert
Get answers to your questions about how to teach this experiment with our support team.
- Call toll-free: 888-837-6437
- Chat with Us
- Email support@vernier.com
Purchase the Lab Book
This experiment is #9 of Real-World Math with Vernier. The experiment in the book includes student instructions as well as instructor information for set up, helpful hints, and sample graphs and data.