Displaying Data
Experiment #4 from Vernier Coding Activities with Arduino®: Analog Sensors
- Subject
- Engineering
Introduction
In the “Calibrating a Sensor” activity, you displayed data using the Serial Monitor. In this activity, you will see how the Serial Plotter can be used to easily view data in a graph. You will also experiment with how you can use code to format the data in the Serial Monitor to make it more useful.
Objectives
- Understand formatting output to the Serial Plotter (computer only)
- Understand formatting output to the Serial Monitor
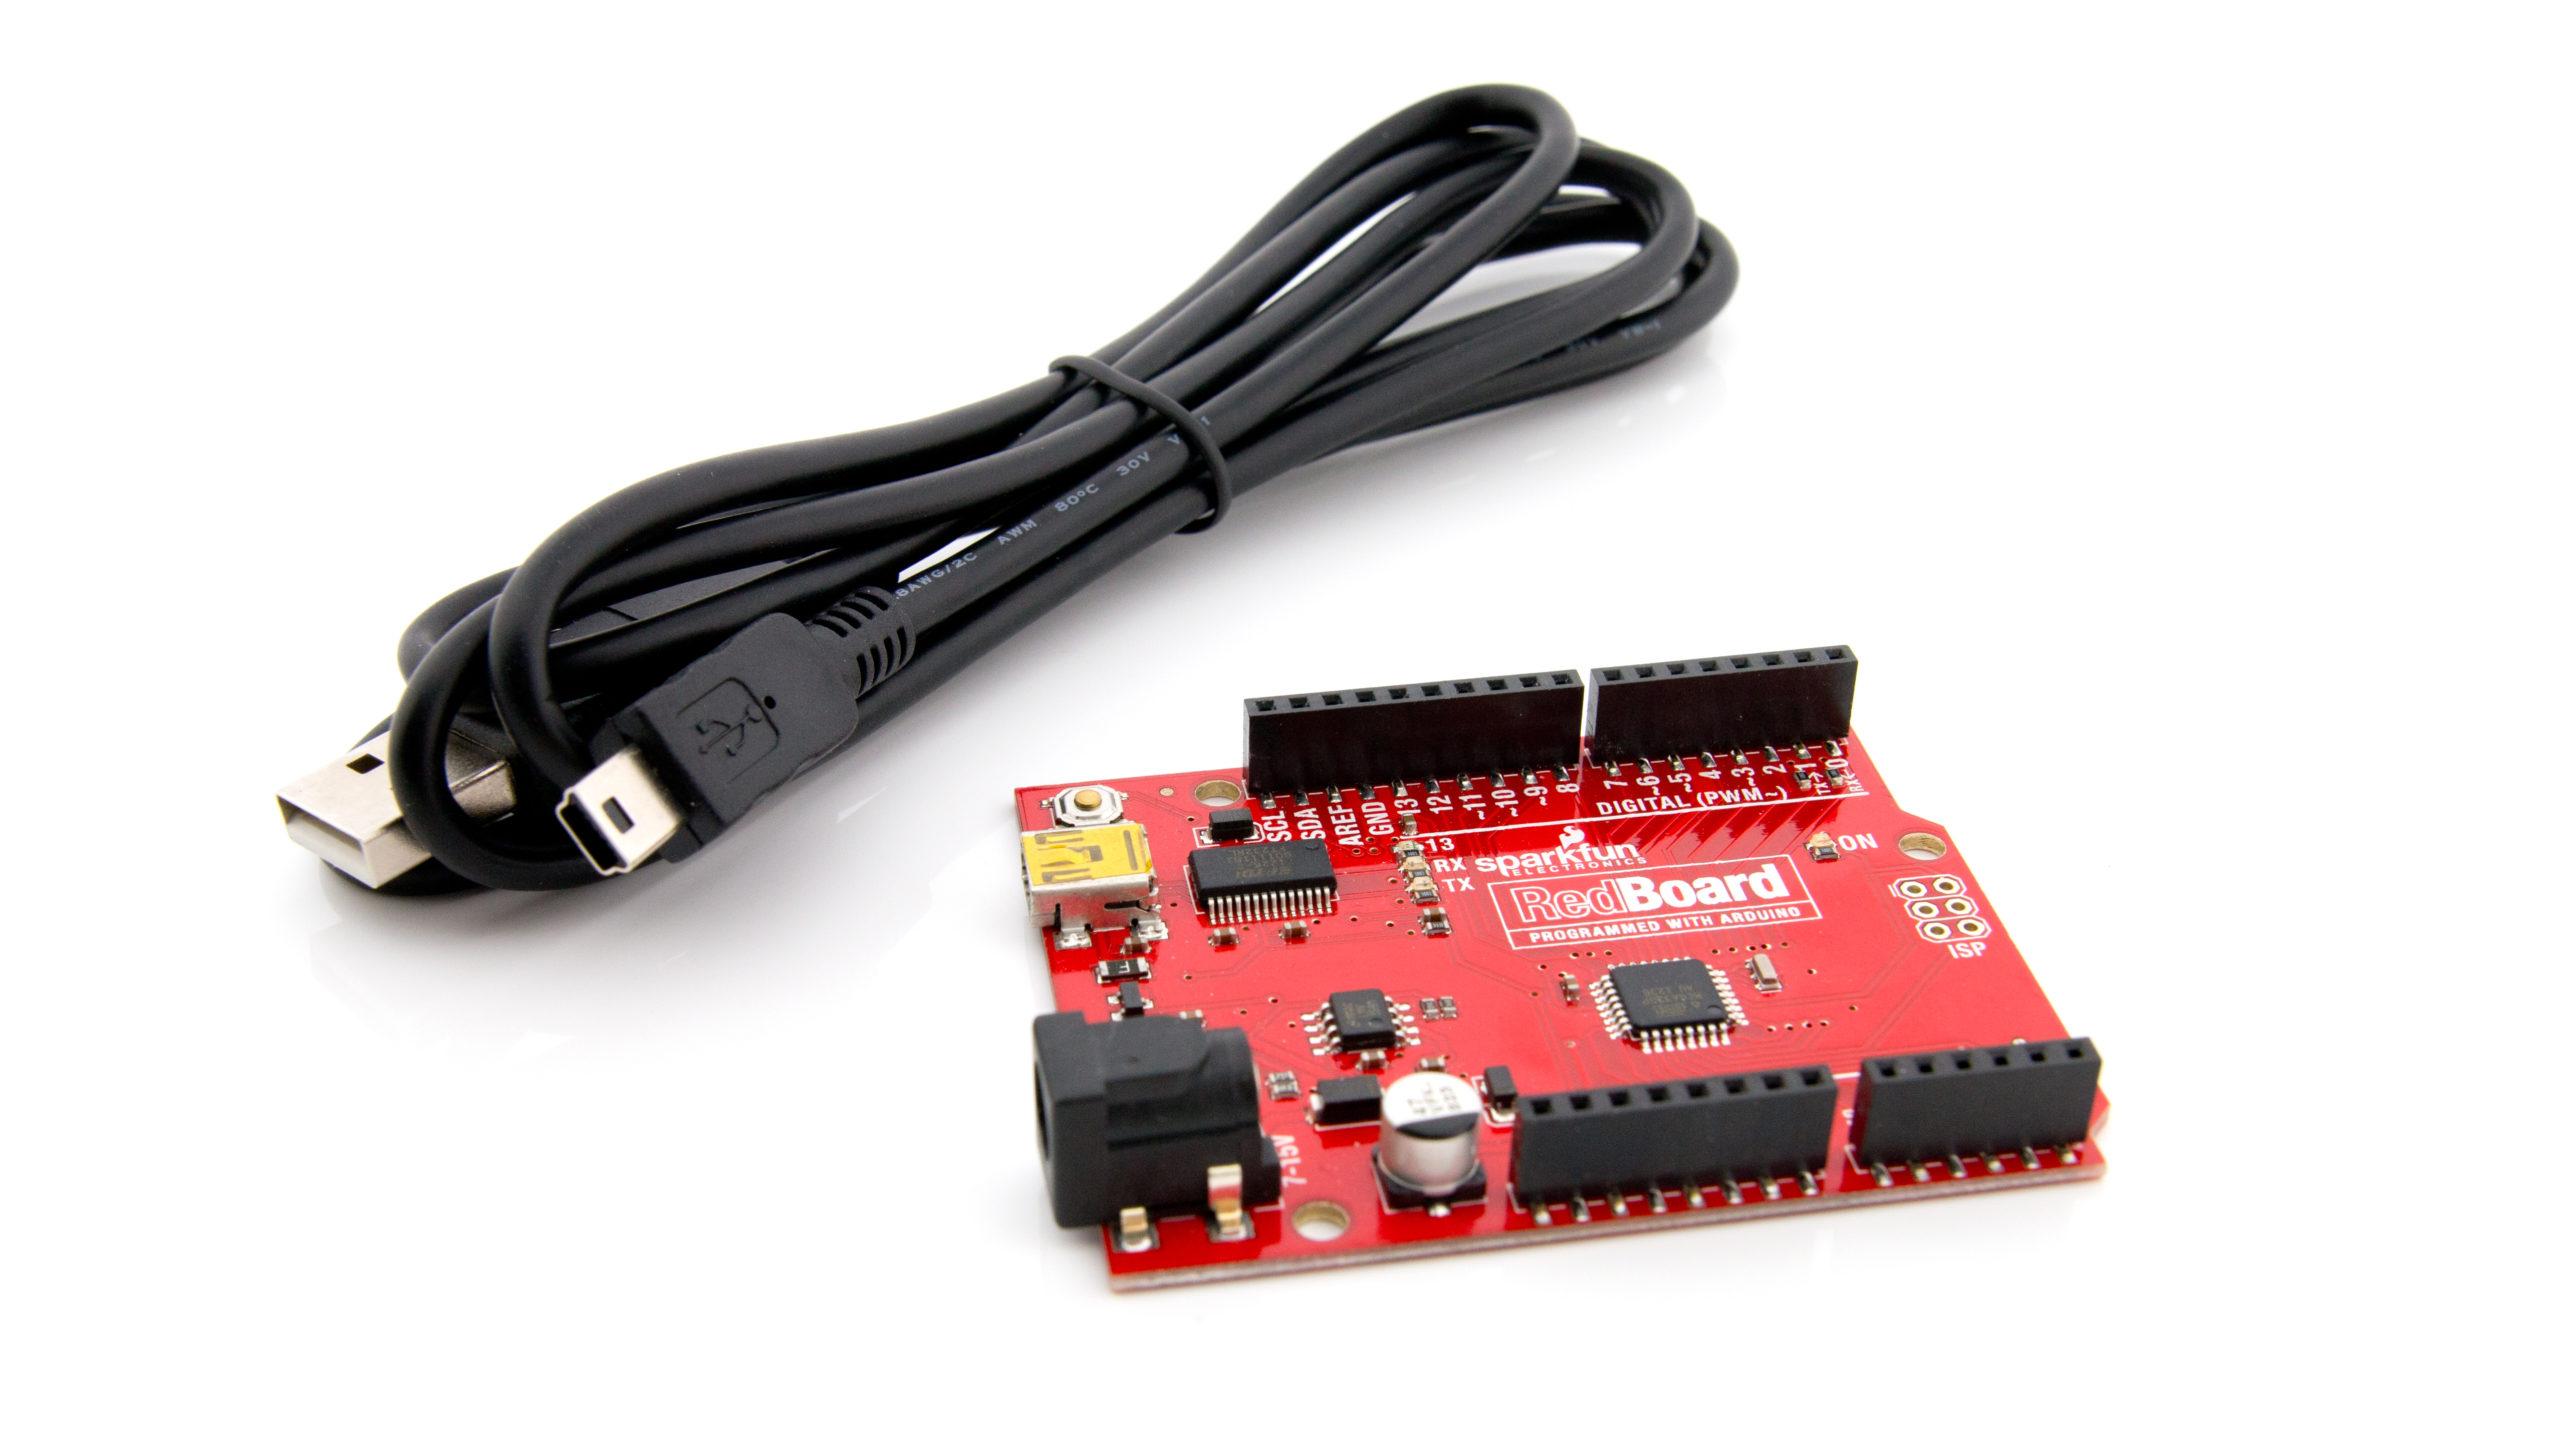
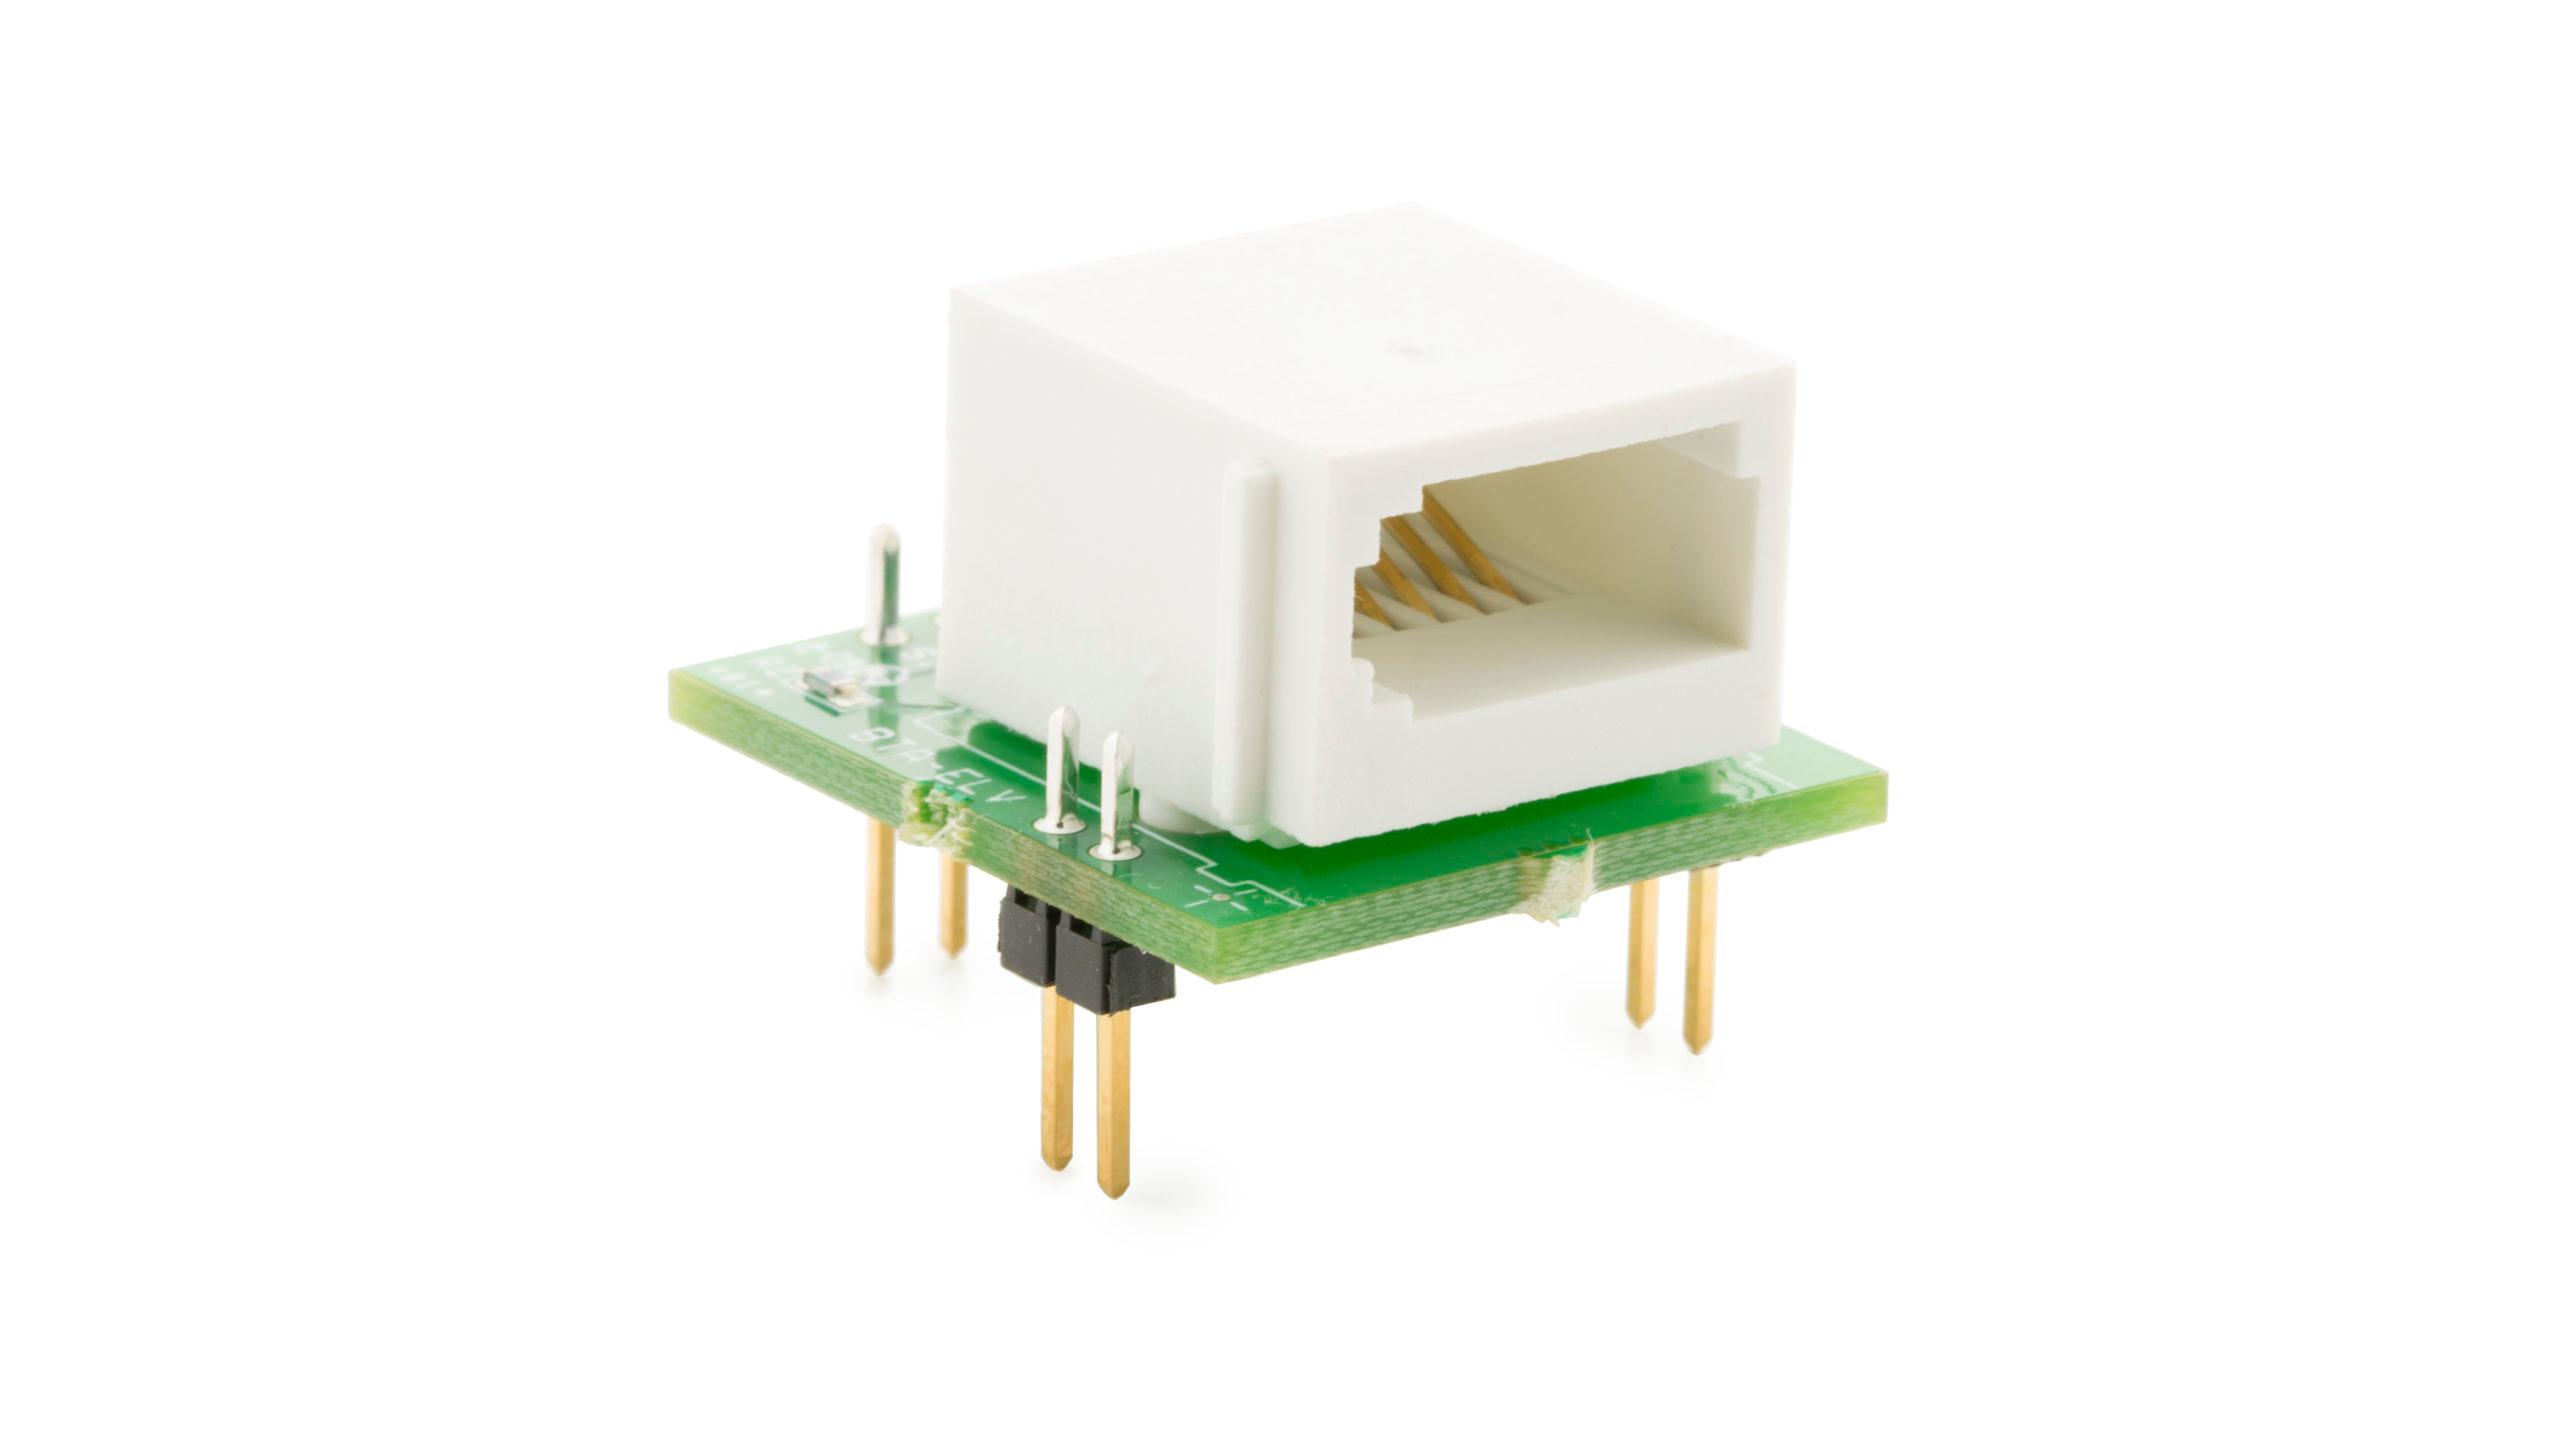
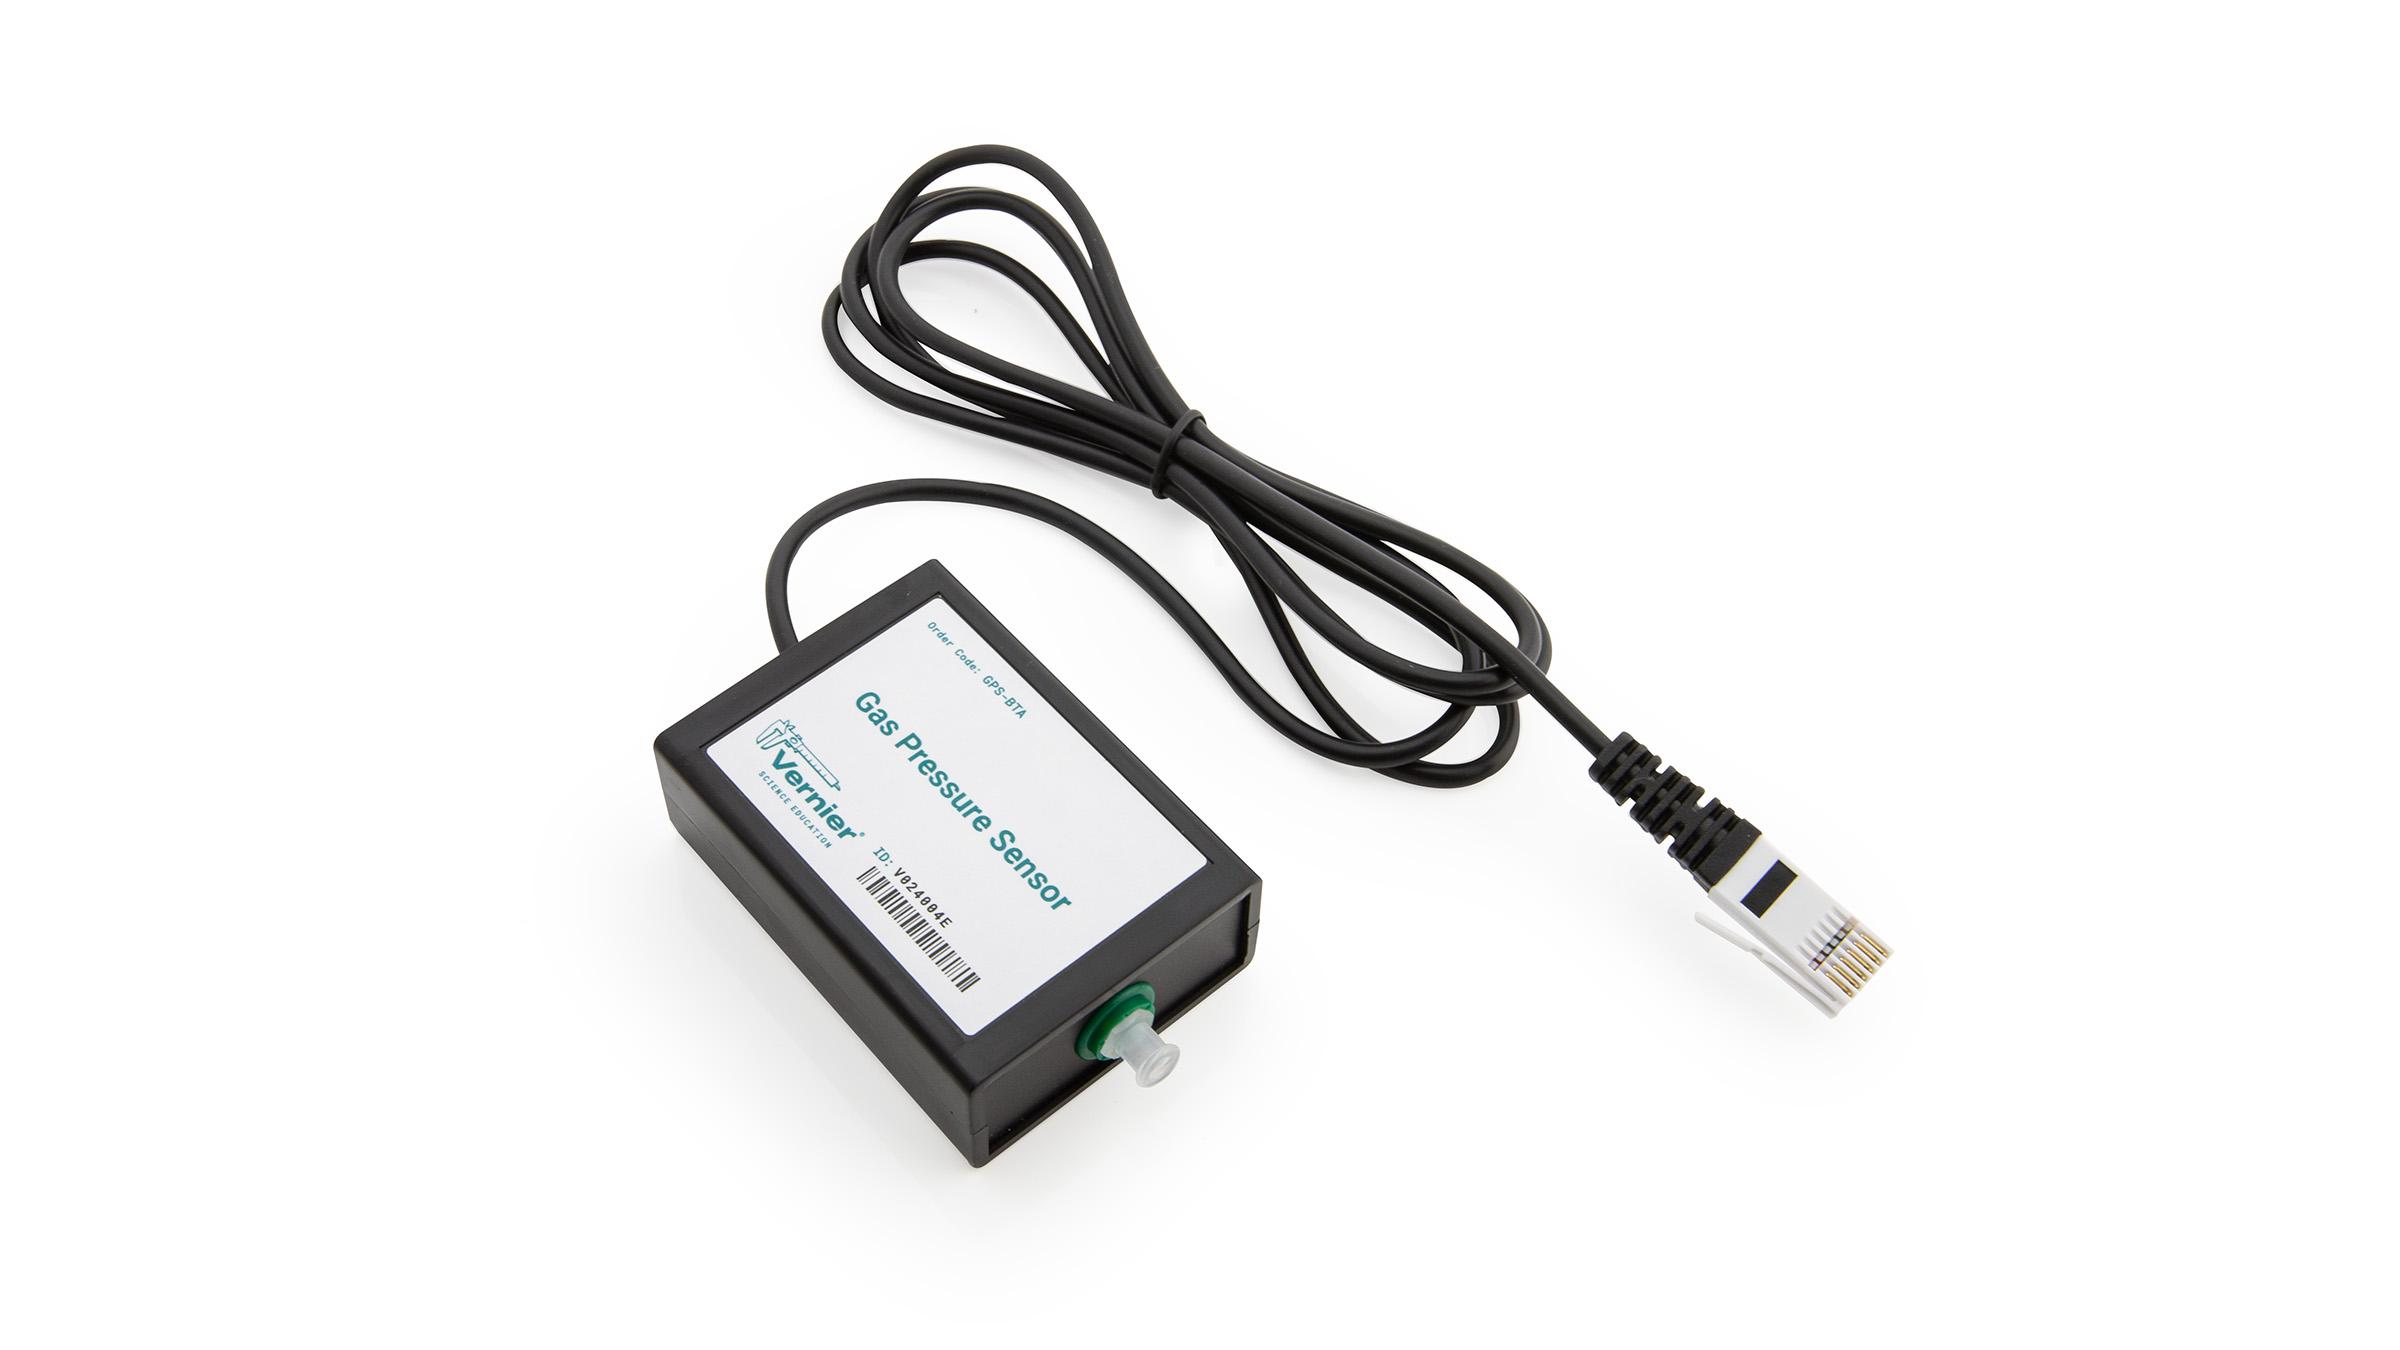
Sensors and Equipment
This experiment features the following sensors and equipment. Additional equipment may be required.
Ready to Experiment?
Ask an Expert
Get answers to your questions about how to teach this experiment with our support team.
- Call toll-free: 888-837-6437
- Chat with Us
- Email support@vernier.com
Purchase the Lab Book
This experiment is #4 of Vernier Coding Activities with Arduino®: Analog Sensors. The experiment in the book includes student instructions as well as instructor information for set up, helpful hints, and sample graphs and data.