A photogate can be used to simply count blocking events. This is useful for counting the number of rotations of a wind generator or motor or for counting events in an animal behavior experiment.
INSTRUCTIONS FOR USING A VERNIER (BTD) PHTOTGATE
Photogate (
Logger Pro 3
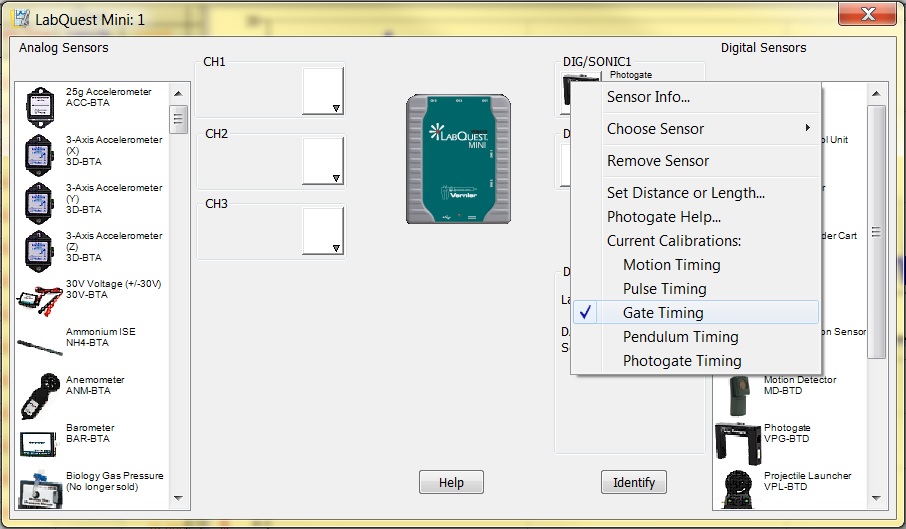
To set up a Vernier Photogate to count blocking events, first set the photogate up in Photogate Timing mode. Choose Set Up Sensors from the Experiment menu and select your interface. In the Sensor Set Up window, click on the photogate and select Photogate Timing mode.
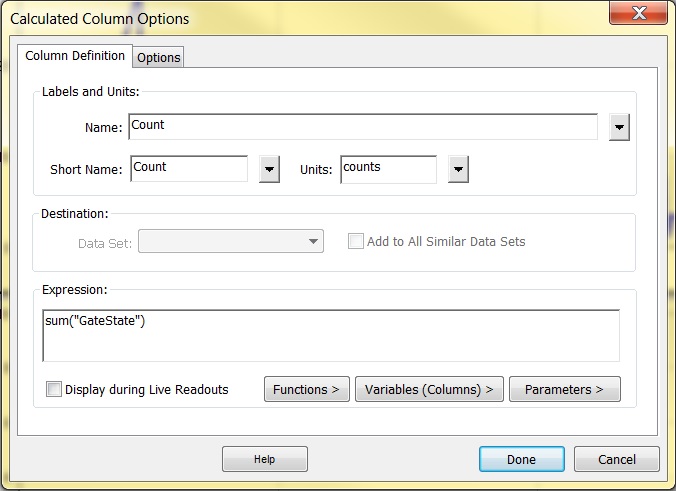
Next, choose New Calculated Column from the Data menu. Name the column “Count” and insert the equation sum(“GateState”)
To see the value for the count during the experiment, choose Meter > Digital Meter from the Insert menu.
Note: While using LabPro, data collection sometimes ends prematurely. As a workaround, manually set up the sensor as a Radiation sensor. This sensor configuration produces a column for counts.
LabQuest App
The LabQuest App does not have a sum() calculation, like Logger Pro 3 does. Consequently, the closest data-collection method is to manually set up the photogate as a Radiation Monitor.
From the Sensor screen in the LabQuest App, choose Sensor Setup from the Sensors menu. The app will already show that a photogate is connected to the appropriate DIG port. Switch it by tapping on the field and selecting Radiation Monitor from the drop-down menu. Tap OK to return to the Sensor screen.
The Radiation Monitor default data-collection method records counts during the specified data-collection duration. Change the data-collection parameters, as necessary.
Graphical Analysis App
Graphical Analysis does not have a sum() calculation, like Logger Pro 3, nor does it allow you to set up a photogate as another sensor like the LabQuest App. The best you can do is export the data as a CSV file and use a spreadsheet to investigate the photogate Gate State data (used in all photogate collection modes).
To export the data, choose Export form the File menu and select .CSV. Save the file to the desired location. The exported file can be opened in a spreadsheet application for further analysis.
Instructions for a Go Direct Photogate (GDX-VPG)
Go Direct® Photogate (
Graphical Analysis App or LabQuest App
When using Go Direct Photogate, you will need to set up the sensor to use the Gate 1 – Gate State sensor channel.
1. Launch Graphical Analysis or turn on your LabQuest 2.
2. Connect the sensor to your device via USB or wireless Bluetooth connection.
3. Change the default sensor channel setup so that Gate 1 – Gate State is the only channel selected.
4. Adjust the data collection mode to Time Based.
5. Set the End Collection Duration as needed for your experiment.
6. Collect data as desired.
7. From the File menu, select to Export data as a CSV file (Graphical Analysis) or Text file (LabQuest App). The exported file can be opened in a spreadsheet application for further analysis.
Alternatively, you can export a AMBL file (Graphical Analysis) or save a QMBL file (LabQuest App) for use with Logger Pro 3.
Related TILs:
How do I set up wired Vernier Photogates (VPG-BTD) for data collection with Logger Pro 3?
How do I set up wired Vernier Photogates (VPG-BTD) for data collection using LabQuest App?
How do I set up wired Vernier Photogates (VPG-BTD) for data collection using Graphical Analysis and Graphical Analysis Pro?
How do I set up a Go Direct Photogate to collect data using LabQuest App?
How do I set up a Go Direct Photogate to collect data using Graphical Analysis or Graphical Analysis Pro?