Using Go Direct Sensors with Android
About Graphical Analysis
Graphical Analysis is our free application to collect, graph, and analyze data from Go Direct sensors. If you don't have Graphical Analysis installed, please download and install it first.
Graphical Analysis in a Browser
You can also use Graphical Analysis in a Chrome browser. See instructions for Graphical Analysis in a browser. Note: To collect data from Go Direct sensors via USB (when supported on your Android device), follow the browser instructions.
Connect Your Sensor Using Bluetooth®
- Ensure your sensor is charged or connected to a power source.
- Turn on your sensor by pressing the power button once. The Bluetooth LED will blink red.
- Launch Graphical Analysis.
- Click or tap
 from the New Experiment list.
 - Click or tap your Go Direct sensor from the list of Discovered Wireless Devices.
- Your sensor’s ID is located near the barcode on the sensor label.
- You can type part of your sensor’s ID in the
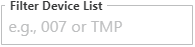 to quickly find your sensor.
 - You can use
 to connect to your sensor automatically. This feature assumes your sensor is the one with the strongest Bluetooth signal.
 - The Bluetooth LED on the sensor will blink green when it is successfully connected.
- If your sensor has multiple sensor channels, you can change the default settings.
- Click or tap
 .
. - Select the sensor channels you want to use.
- Click or tap
- Click or tap
 .
. - The app will load a default data-collection setup. You are now ready to continue your experiment.
Video Demonstration
Resources
- How do I change the default settings on sensors with multiple channels?
- Why is Graphical Analysis for Android requesting permission to see my location?
- Connection Instructions for LabQuest (BTA and BTD) Sensors
- Connection Instructions for Spectrometers
- Connection Instructions for Chemistry Instruments
Need Assistance?
Call
Toll-free: 1-888-837-6437
Fill out a support request or reach us at support@vernier.com