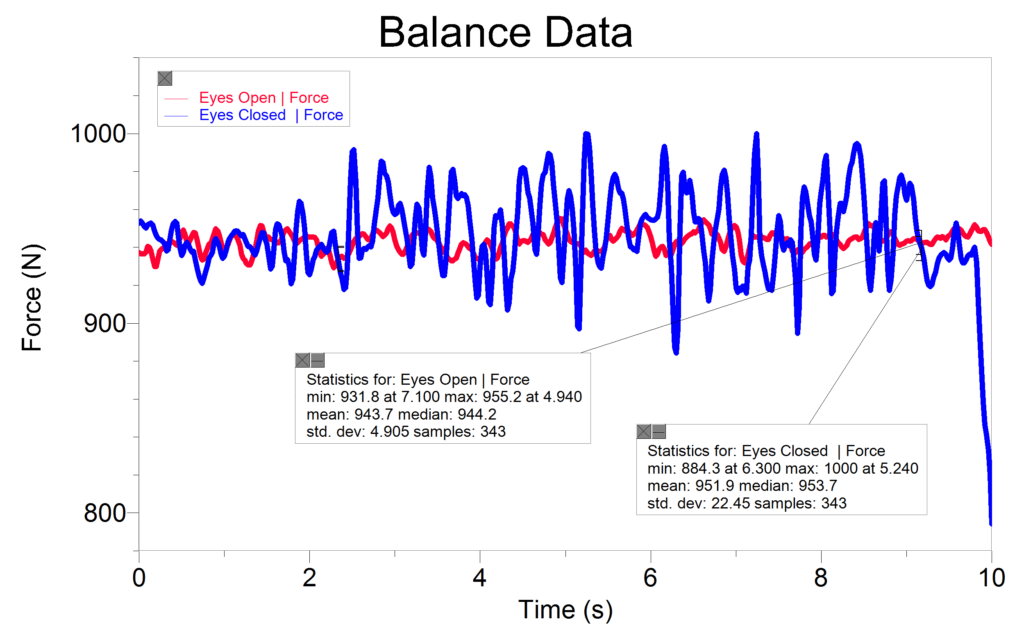
The sense of balance is complex since it combines sensory input from the eyes, inner ear, and stretch receptors located in the tendons and muscles. In the classroom, you can demonstrate that visual input is important for balance. Try balancing on one foot with your eyes open, and then try it again with your eyes closed. You will find that balancing on one foot with your eyes closed is much more difficult than doing this with your eyes open.
John Melville, our Biology Staff Scientist, has developed a simple and innovative way to quantify this difference in balance using a Force Plate. Just have a student balance on the Force Plate using one foot with their eyes open. When the student is ready, collect data for ten seconds. As the student shifts back and forth to maintain his or her balance, the force on the Force Plate will increase and decrease. The same test is then repeated while the student has his or her eyes closed.
Students analyze their results by determining how much the force profile shifts back and forth during each balance test. The simplest way to do this is to find the standard deviation of the force profile during each test. The standard deviation tells us how far away a measurement is from the mean or average. In this case, the standard deviation of the force is a measure of how hard or easy it is for the student to balance. You can quickly determine the standard deviation of the force for each run using the Statistics tool in Logger Pro. If you are using a LabQuest, choose the Statistics option from the Analyze menu.
In the sample data below, the standard deviation of force when the student is balancing with his or her eyes open is ±4.905 N. When the student’s eyes are closed, the standard deviation of force during the balance test is ±22.45 N.

This is a great activity that lends itself to inquiry. Students can easily compare the balance of males and females, athletes and non-athletes, or dancers and non-dancers, among others.
