Sound Cloud Installation Makes All the Difference in the Vernier Classroom
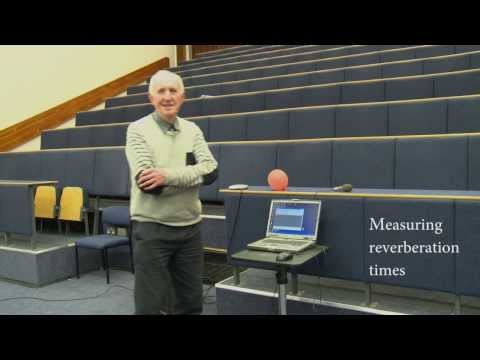
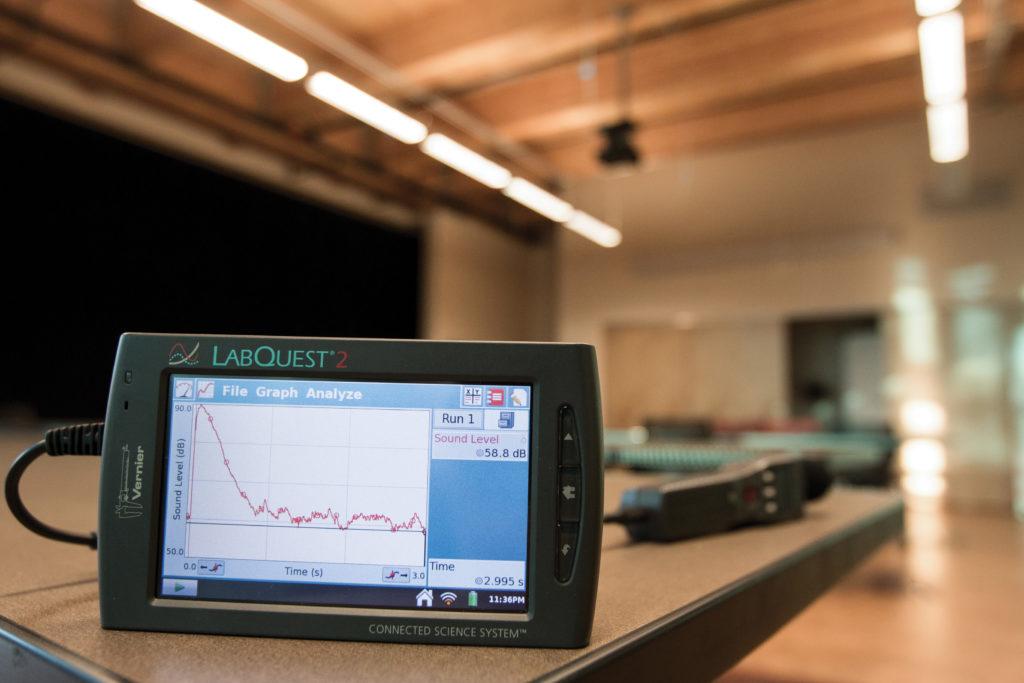
We built a classroom in an addition to the Vernier office last summer. In early workshops there, we noticed that it was sometimes difficult for people to hear. The problem was that the walls, floor, and ceiling were all very reflective—the room had a long reverberation time. One quick way to estimate reverberation time is to use our Sound Level Meter to measure how quickly the decibel sound level drops when a loud sound is made. To test this, we set up the sensor on a LabQuest 2 using triggering. We started data collection, then clapped our hands. We noticed that the sound level dropped off much more slowly in our classroom than it did in other rooms.
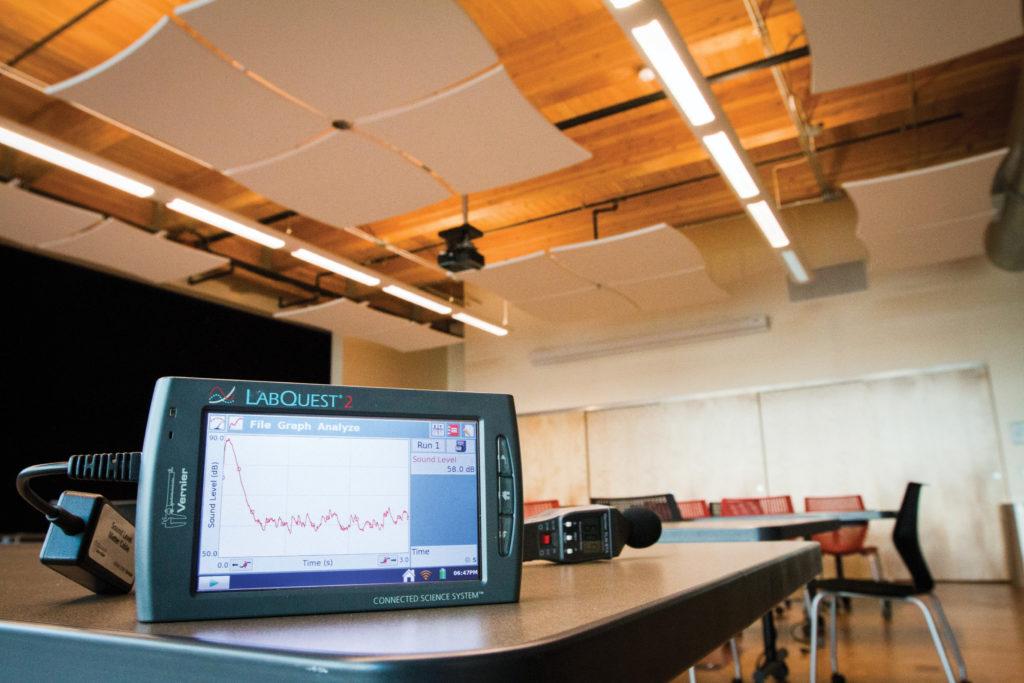
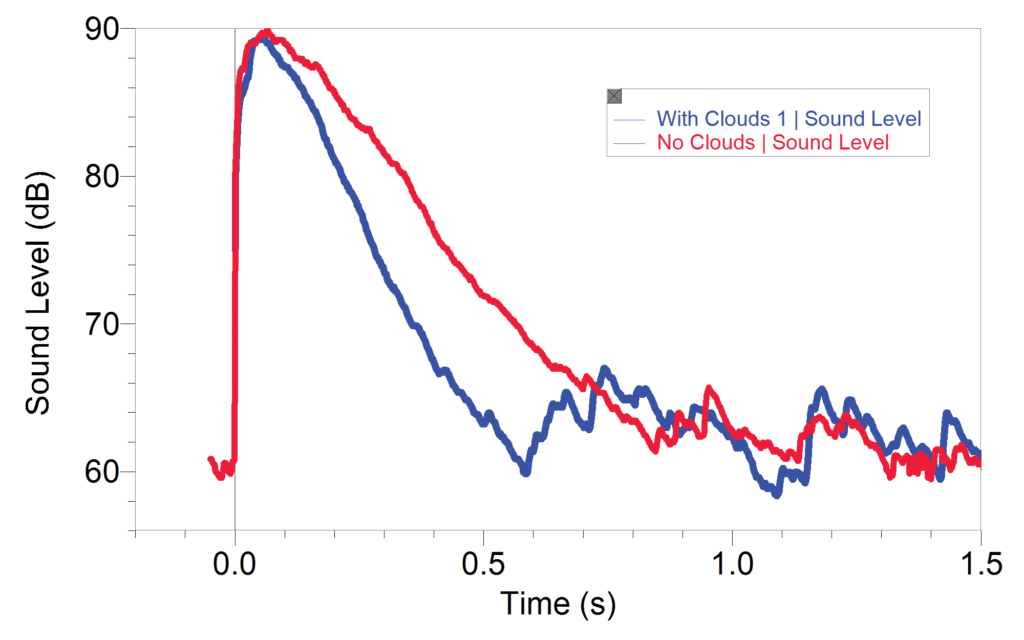
We added acoustic clouds to our classroom to fix the situation, and it has improved greatly. Data collected before and after the cloud installation show a shorter reverberation time.
Estimating Reverberation Time Using Our Sound Level Meter
Reverberation time is usually defined as the time it takes the sound energy to drop by a factor of a million, or 60 dB. In most situations, you will not see that large a change in decibel sound level. For example, in our study of the sound in our classroom, the loudest sound is about 90 dB and the level drops to about 60 or 65 dB later. The background room noise is about that level. So how can you estimate the reverberation time? One way is to do a linear fit of the sound level vs. time graph and determine the slope. This is the rate at which the sound level is dropping (in dB/second). You can use this slope to estimate how long it would take the sound level to drop by 60 dB. That is the reverberation time.
- Reverberation time = time it takes to sound level to drop by 60 dB
- Slope = Δ sound level/time
- Reverberation time = 60 dB/slope
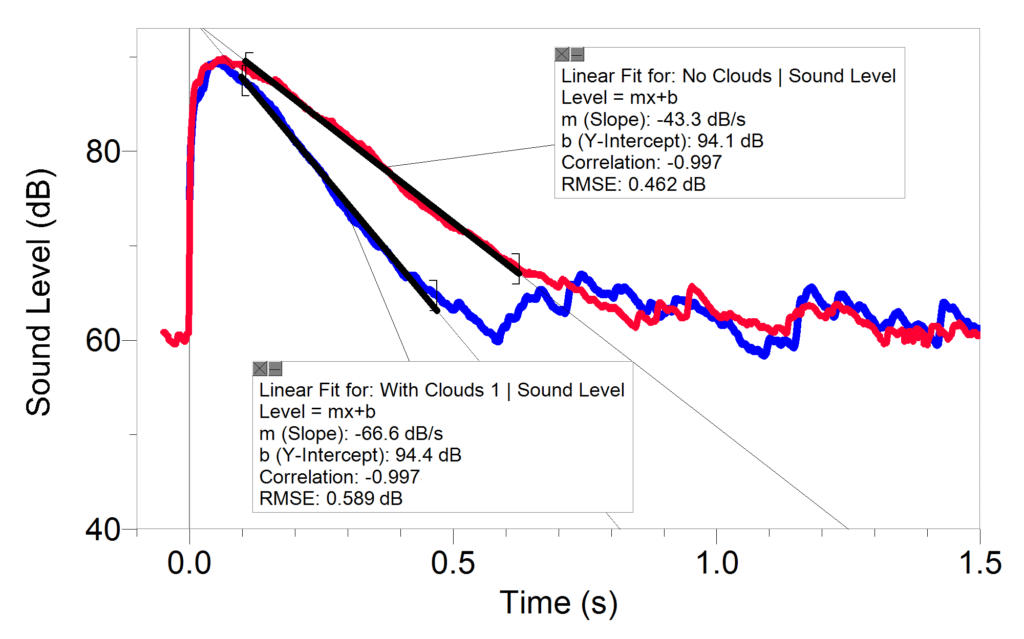
Using the data in the figure above, the reverberation times, before and after would be:
- Reverberation time before = 60 dB/43 dB/s = 1.4 seconds
- Reverberation time after = 60 dB/66 dB/s = 0.90 seconds
When we took this data, we made the sound by clapping our hands loudly. We use Logger Pro, set up for data collection with triggering so the actual data collection begins when the sound level increases above a threshold. A better way to do this reverberation time measurement and the way used in most articles on the subject is to use a pink or white noise generator connected to an amplifier and a speaker system to generate the noise. As you collect data, turn off the sound and study how fast the sound level drops.
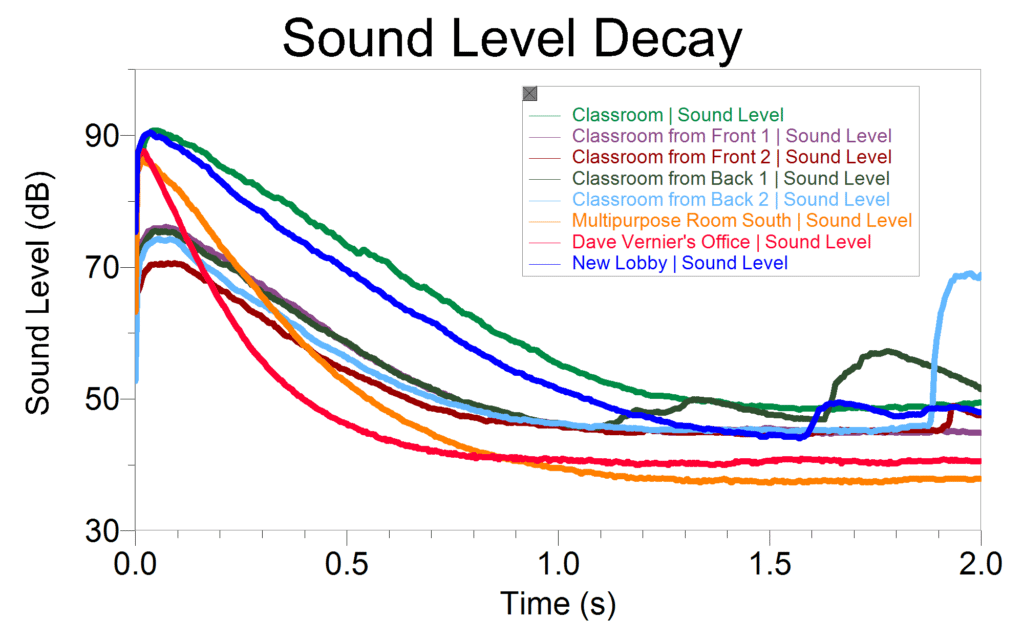
We did a study of number of rooms in our building. In each case, We started Logger Pro data collection (with triggering), clapped my hands loudly, and monitored the change in sound level. The slowest decay shown here was our classroom before the acoustic clouds were added. The fastest decay was in a small office with carpeting and acoustic tile on the ceiling.
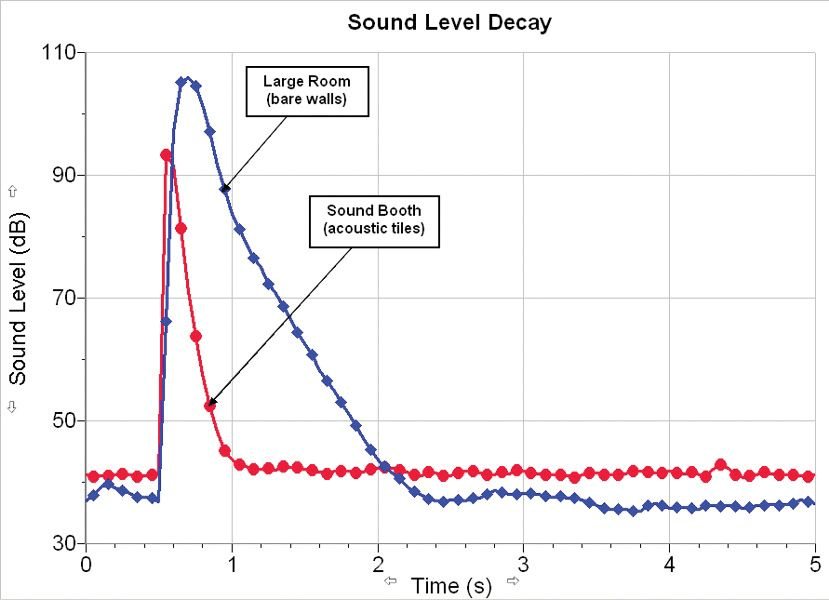
Below are two similar reverberation time tests done in very different rooms. These were included in our Sound Level Meter user manual. We took the data the same way in a small gymnasium with hard surfaces everywhere and in a room designed to be sound absorbing. In the gymnasium with the very long reverberation time, it was difficult to have a conversation.
For more information on measuring reverberation times with a Sound Level Meter see the Wikipedia article or the video below.