Analyzing Times from the Hundred-Meter Dash
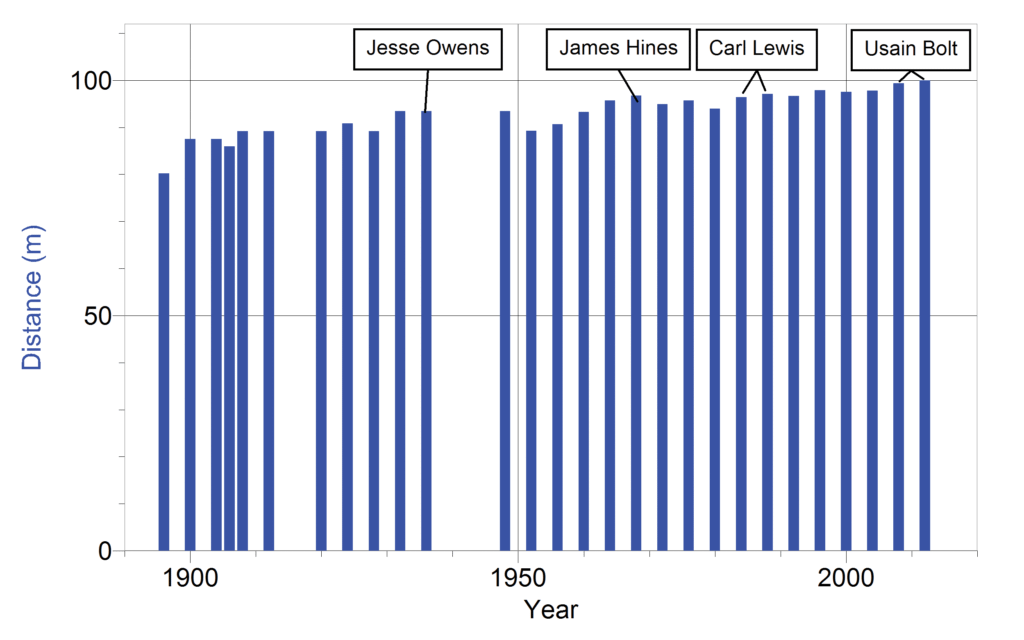
Many students were fascinated by the recent Olympics. One way to capitalize on this interest is to have the students use Olympic results to improve their graphing skills and learn some kinematics. We have created a Logger Pro file that uses historic times for the 100-meter dash to simulate the finish of a race with all the Olympic winners.
The top of each bar on the graph shows where the runner would have been at the finish. We assumed constant velocity and calculated distance traveled in the time of the most recent (and fastest) race. The 1896 winner would have been a full 20 meters behind the most recent winner.
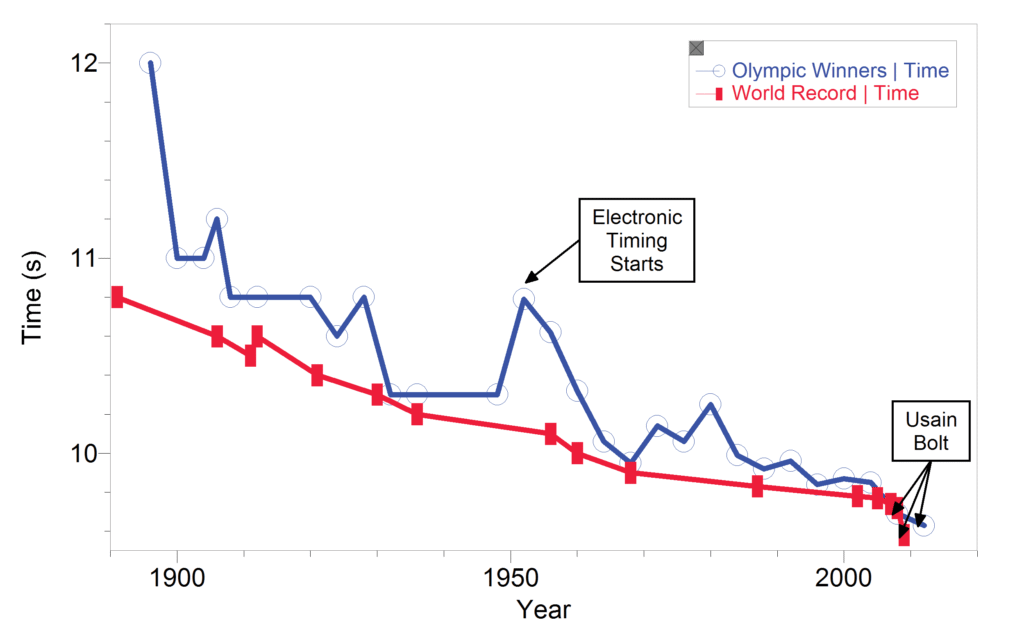
The Logger Pro file also has a page with a graph comparing Olympic and world records over time. It is relatively easy to modify this file for any event that a student is interested in studying.


